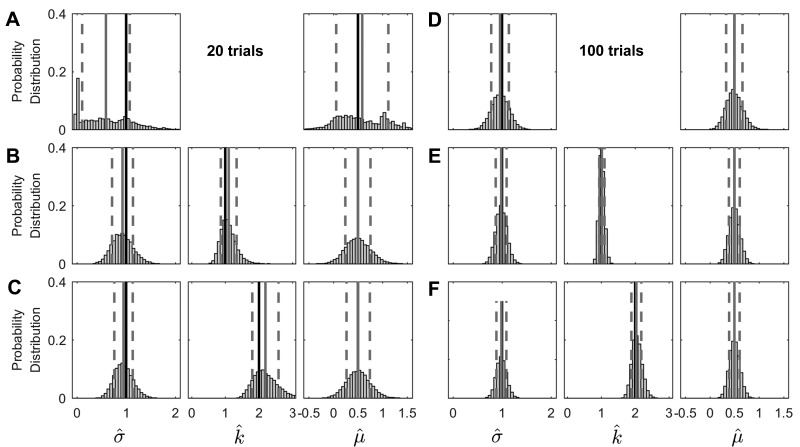
Fig. 7.
Parameter distributions show parameter estimates for 10,000 simulated experiments with 20 and 100 trials. The columns from left to right represent the fitted psychometric width parameter (), the fitted confidence scaling factor (), and the fitted psychometric function bias () as shown on the x-axis at bottom. A and D: fitted parameters of conventional binary forced-choice parameter estimates. B and E: fitted parameters estimates determined via our CSD model fit for a well-calibrated subject (k = 1). C and F: fitted parameters estimates determined via our CSD model fit for an underconfident subject (k = 2). The solid black line shows the actual parameter value (i.e., μ = 0.5 or σ = 1), the solid gray line shows the mean of fitted parameters, and the dashed gray lines indicate SD on each side of the mean.

