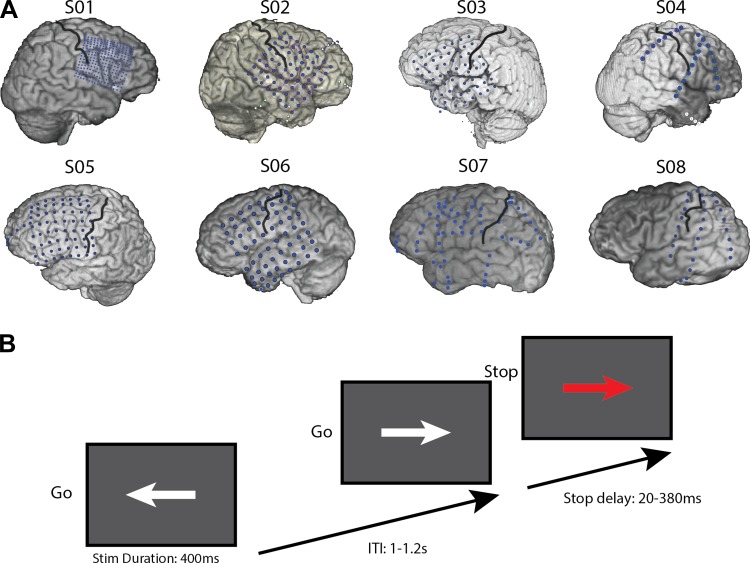
Fig. 1.
A: CT and structural MRI reconstructions of individual subject electrode coverage. Black lines denote the central sulcus. Note that S04 had bilateral prefrontal strips (left side not shown). Note also that the grid for S03 has shifted ∼1 cm anterior after the CT was done, based on motor and auditory responses from a different task run in this subject (data not shown). The original CT–MR reconstruction shown here does not reflect this suspected shift. B: schematic of the stop-signal task used in the present study. Stim Duration, stimulus duration. ITI, intertrial interval.

