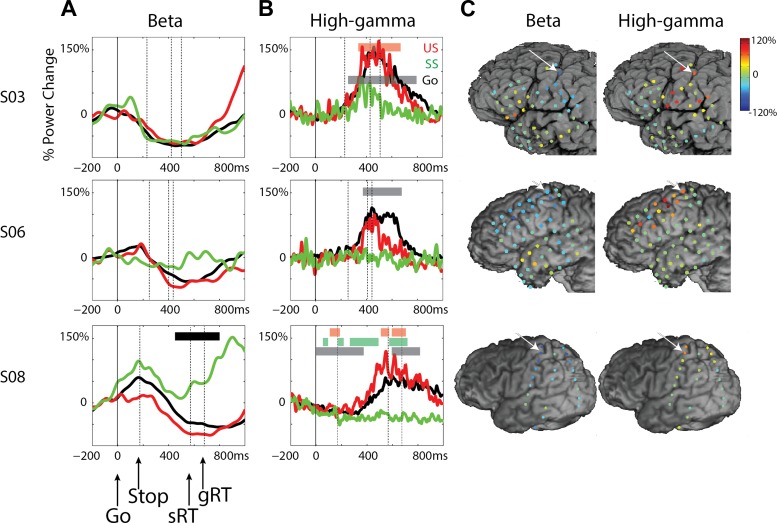
Fig. 3.
Beta and high-gamma time courses for M1 for subjects S03, S06, and S08. A: time-course plots for beta power in the 3 conditions: Go (black), successful stop (SS; green), and unsuccessful stop (US; red). Horizontal black bar signifies the time window with a significant difference between US and SS (P < 0.05, FDR corrected). B: time-course plots for high-gamma power in the 3 conditions. Dashed, vertical lines indicate the average time point of the stop signal, the reaction time in unsuccessful stop trials (sRT), and reaction time for Go trials (gRT). Colored bars signify the time window with significant differences compared with baseline (P < 0.05, FDR corrected). C: beta (left) and high-gamma (right) power changes for US shown for all electrodes. Data shown are time locked to the response and averaged over −50 to 50 ms relative to the response time. The arrows indicate the location of electrodes shown in other panels in this figure.

