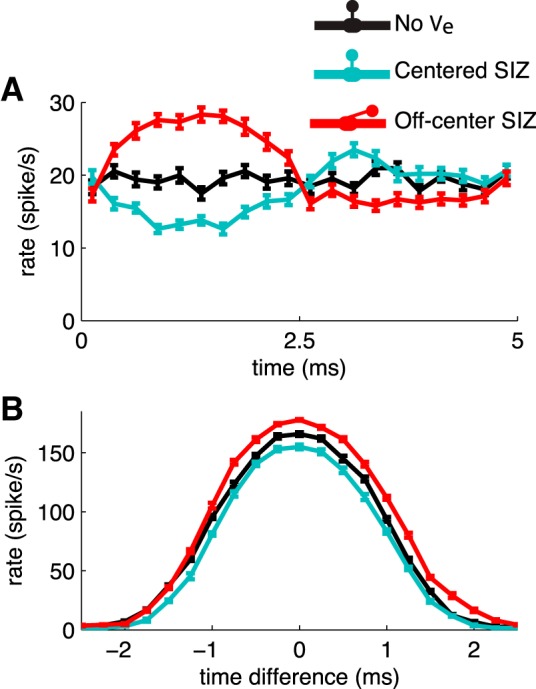
Fig. 12.

Ephaptic effects on spike timing and coincidence detection. A: cycle histogram of test neuron response to bilateral trains of excitatory synaptic events. Event times of input trains are generated from independent homogeneous Poisson processes. Average firing rates calculated in 0.25-ms bins from 50 simulations of responses to 10-s-long input trains. Error bars are SE. B: time-difference tuning curves for test neuron's response to bilateral trains of excitatory synaptic events. Event times of input trains are generated from independent inhomogeneous Poisson processes. Poisson rate for the underlying Poisson process is a 200-Hz half-wave rectified sine function with an average event rate of 100 events/s. The timing difference of the half-wave rectified sine Poisson rates is shown on the x-axis with 0-ms time difference representing rate functions to both dendrites that are in phase relative to one another and relative to the input to the MSO population. Firing rates were computed from responses to 10-s-long inputs. Mean and SE (error bars) were obtained by dividing these responses into 10 segments and counting spikes in each 1-s-long subintervals. Model configurations and color code are same as in Fig. 11D. Input to MSO population (generators of Ve) is 200-Hz half-wave rectified sine function excitation with same bilateral time differences as input to test neuron.
