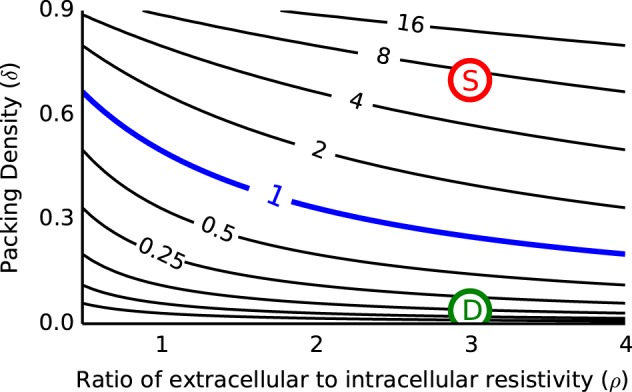
Fig. 2.

Contour plot of the coupling parameter κ for plausible values of packing density (δ) and resistance ratio (ρ). Coupling parameter is κ = ρδ/(1 − δ), contour lines have logarithmic spacing (powers of 2). We use κ = 1 (blue contour) in simulations of the cable model with ephaptic coupling. Estimates for κ in the MSO model are marked with colored circles. κ is larger surrounding the soma (7, red S) than the dendrite (0.12, green D) since the larger diameter of the soma implies a larger packing density (δ = 0.7 for soma and 0.038 for dendrites; ρ = 3 throughout).
