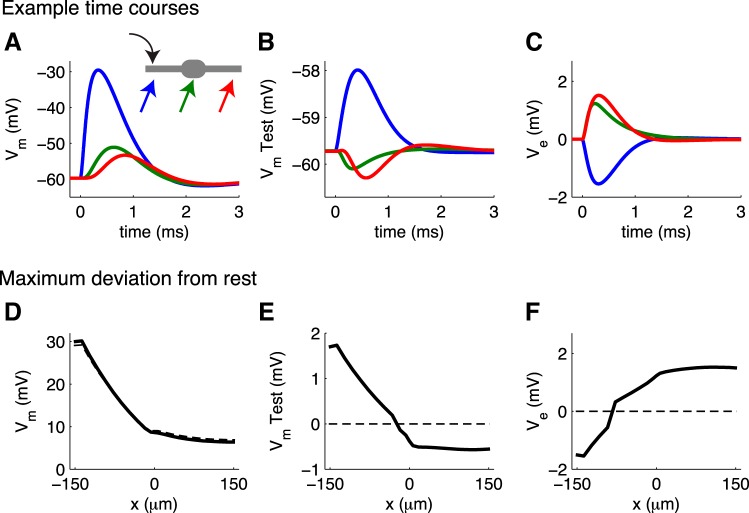
Fig. 9.
MSO response to monolateral synaptic excitation; test neuron receives no synaptic stimulation. A–C: example time courses of Vm in MSO population, V̂m in the test neuron, and extracellular Ve at 3 locations along the neuron. Schematic in A shows these locations (left dendrite near the input site, soma, and right dendrite) and input location (left dendrite). D–F: spatial profiles of maximum deviation from resting voltage for Vm, V̂m, and Ve. y-Axis is deviation from resting voltage and can be compared to steady-state passive cable responses in Fig. 3. Results for simulations without ephaptic coupling are dashed lines; results for simulations that include ephaptic coupling are solid lines.

