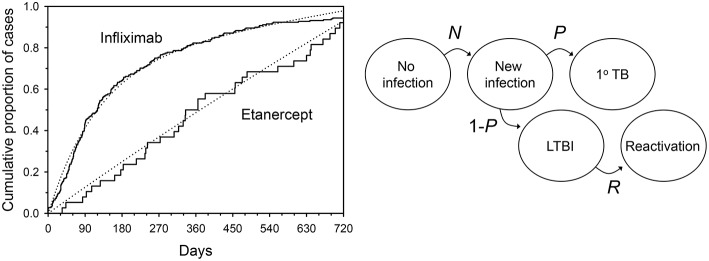
Figure 2.
Tuberculosis occurring during tumor necrosis factor blockade. Left: Solid lines indicate time to onset distributions as reported to US FDA from January 1998 through March 2003. Dotted lines indicate the distributions resulting from a typical mathematical model during Monte Carlo simulation. Right: Hidden Markov model of tuberculosis etiology during TNF blockade. N = monthly proportion acquiring new infection with Mycobacterium tuberculosis; P = proportion of new infections progressing directly to active TB; R = monthly proportion of latent TB infections undergoing reactivation. From (Wallis, 2008), with permission.

