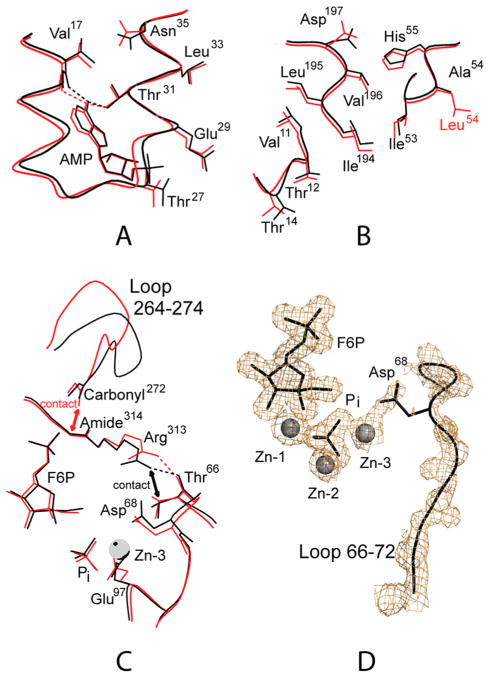
Figure 3.
Tertiary conformational changes between the IR and IT states. Dotted lines represent selected donor–acceptor interactions of 3.2 Å or less. Double-headed arrows represent tight contacts of less than 3 Å. Superposition of the IR-state subunit from the AMP complex of Leu54 FBPase (red) onto each subunit of the AMP complex of Asp10 FBPase (black) reveals a conformational change induced by a 9° subunit-pair rotation. (A) Conformational changes at the AMP binding site. (B) Conformational changes from helix H1 to loop 190 and then across a subunit interface to hinge residues of the dynamic loop. (C) Conformational changes in the hairpin turn of the dynamic loop, loop 264–274, and Arg313. (D) Electron density from an omit map contoured at 1σ showing the density for active-site ligands and part of the dynamic loop. This drawing was prepared with MOLSCIRPT.61

