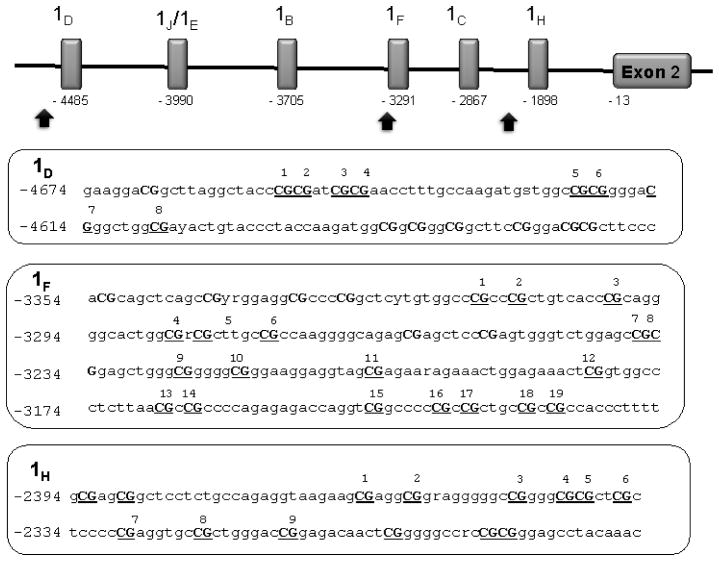
Figure 1. Schematic diagram of noncoding alternate first exons in the NR3C1 promoter region.
Schematic diagram of noncoding exons in the NR3C1 promoter region. Upper panel: The number below each noncoding exon represents the distance to the translational start located at −13 nucleotides upstream of the start of Exon 2. The arrows represent the regions sequenced in this study, the promoter of exon 1D, promoter and exon 1F and promoter of exon 1H. Lower panel: The boxes contain the genomic sequences analyzed for each region. The analyzed CpG loci are underlined and numbered according to each exon region.

