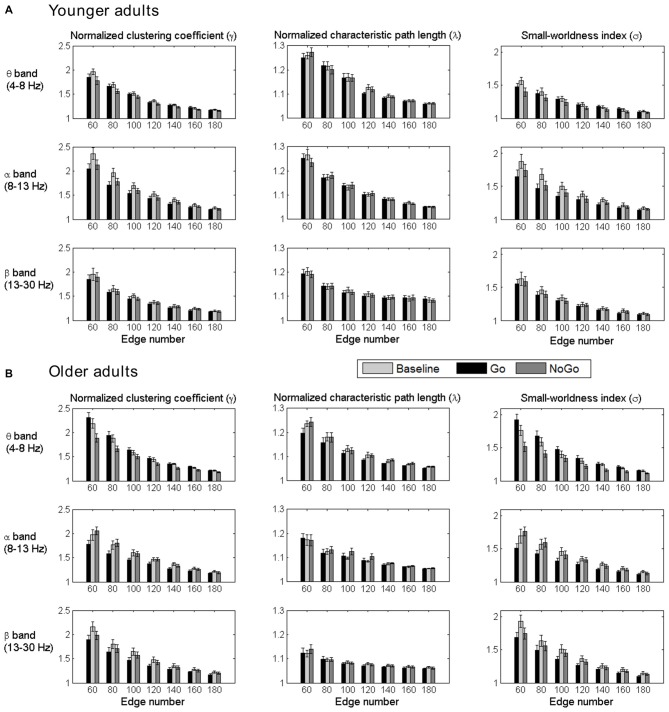
Figure 3.
Group-averaged normalized clustering coefficient (γ), characteristic path length (λ) and small-worldness index (σ) of the brain networks for all task conditions (Baseline, Go, NoGo) in the younger group (A) and older group (B) under different network density levels. Error bars indicate the standard error of the mean (SEM).

