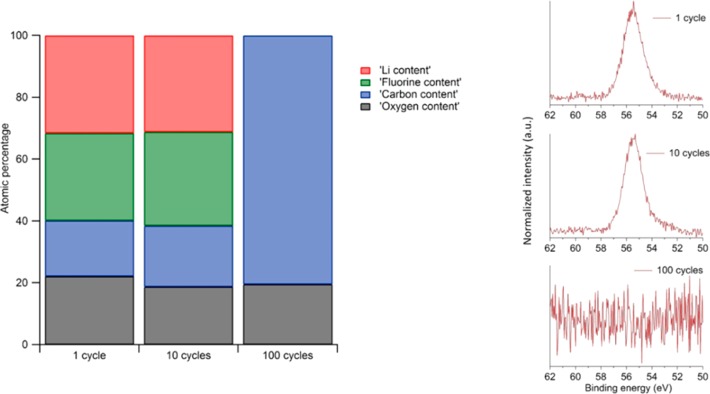
Figure 12.
(Left) Evolution of Li (red), C (blue), O (black), and F (green) content in the SEI at the silicon electrode surface at the end of lithiation in Li-ion configuration, as a function of the cycle number, deduced from XPS measurements. (Right) Li 1s XPS spectra of silicon electrodes after 1, 10, and 100 cycles in Li-ion configuration.

