
Figure 3.
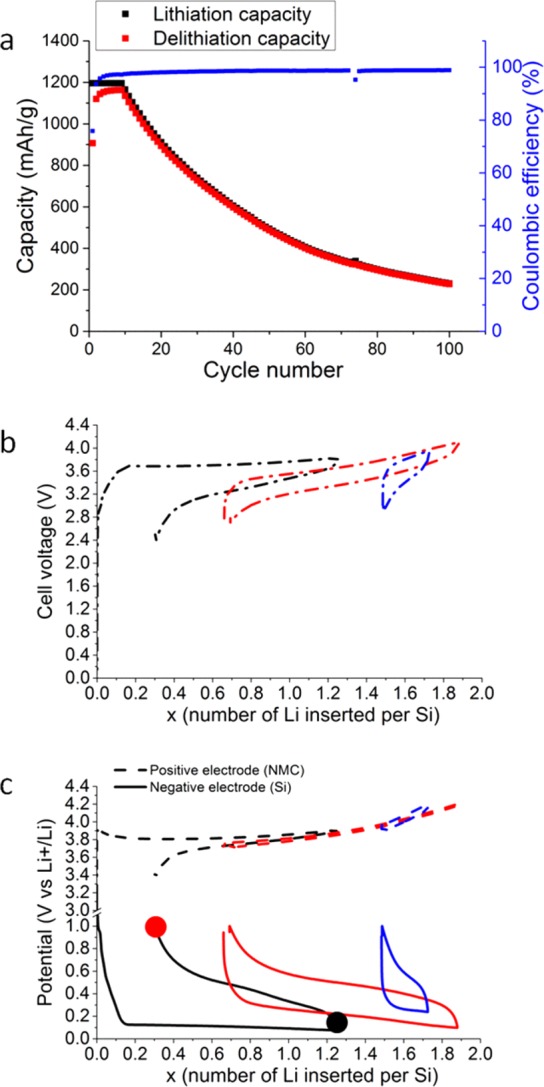
(a) Specific capacity curve vs cycle number for a Si/NMC cell. (b) Charge–discharge curves for a Si/NMC cell. (c) Potential of the NMC electrode (dotted line) and the silicon electrode (solid line) versus x, the lithium content measured in three-electrode Swagelok cells vs a FePO4/LiFePO4 reference and rescaled vs Li+/Li. For clarity purpose, only the first (black), the 10th (red), and the 100th (blue) cycles are shown.