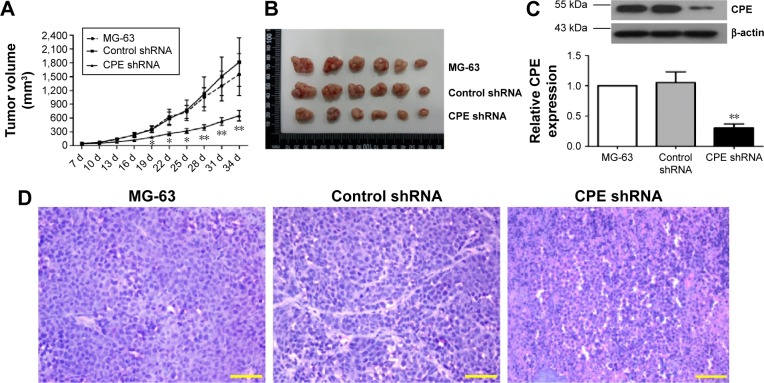
Figure 3.
Silencing of CPE inhibited xenograft tumor growth in vivo.
Notes: (A) MG-63 cells, control shRNA cells, or CPE shRNA cells were subcutaneously inoculated into nude mice. The tumor volumes were recorded every 3 days for 35 days. (B) Visualization of tumor sizes from three different groups. (C) The expression levels of CPE in xenograft tumor tissues were determined by Western blot analysis, with β-actin as the internal control for grayscale comparison. (D) Histological changes of three groups of xenograft tissues were assessed by hematoxylin–eosin staining, magnification 400×, scale bars =20 μm. Data are presented as the mean ± standard deviation of triplicate experiments. Compared with the control group, *P<0.05, **P<0.01.
Abbreviations: CPE, carboxypeptidase E; shRNA, short hairpin ribonucleic acid; d, days.

