Figure 5.
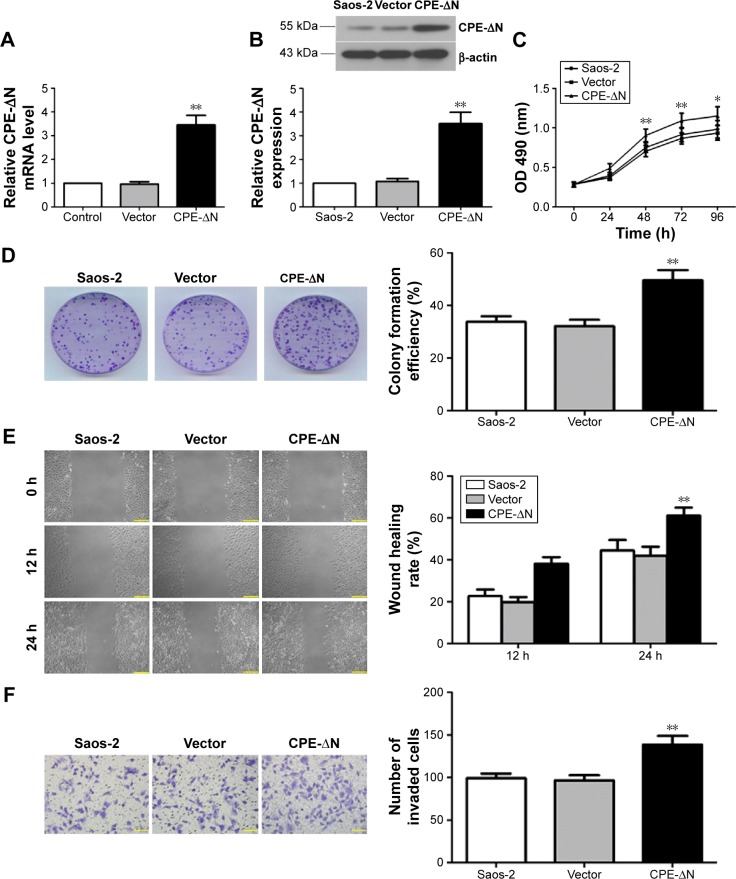
Overexpression of CPE-ΔN promotes cell growth, migration, and invasion of osteosarcoma cells.
Notes: (A) Real-time PCR analysis of CPE-ΔN mRNA levels in Saos-2 cells. (B) Western blot analysis of CPE-ΔN protein levels in Saos-2 cells. Relative CPE-ΔN expression level was quantified by grayscale analysis with normalization to β-actin. (C) Cell proliferation assessed by MTT assay over 96 hours. (D) Cell proliferative capacity was determined by colony formation assay. (E) Cell migration was determined by the wound-healing assay. The migration rates at 12 and 24 hours were calculated. Magnification 100×, scale bars =100 μm. (F) Cell invasive ability was assessed by Matrigel invasion assay, and the invaded cells were counted under the microscope. Magnification 200×, scale bars =50 μm. Data are presented as the mean ± standard deviation of triplicate experiments. Compared with the vector group, *P<0.05, ** P<0.01.
Abbreviations: CPE, carboxypeptidase E; mRNA, messenger ribonucleic acid; MTT, 3-(4,5-dimethylthiazol-2-yl)-2,5-diphenyltetrazolium bromide; PCR, polymerase chain reaction.

