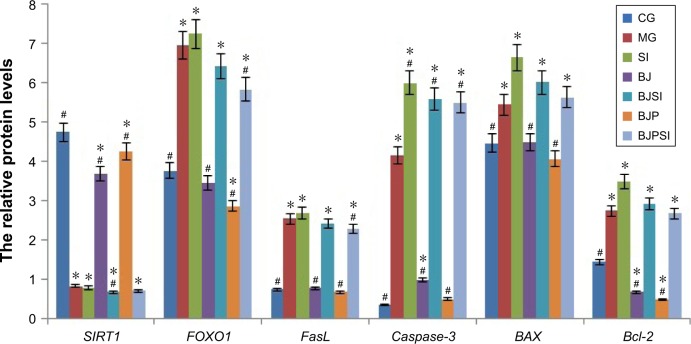
Figure 4.
Real-time quantitative RT-PCR analysis of the mRNA levels of SIRT1, FOXO1, FasL, caspase-3, BAX, and Bcl-2.
Notes: CG is the control group, in which the mice were fed Lieber–DeCarli diet; MG is the model group, in which the mice were fed Lieber–DeCarli diet and alcohol; SI is a model group, in which SIRT1 gene was silenced in the model mice; BJ is a model group, in which the model mice were fed blueberry juice; BJSI is a model group, in which SIRT1 gene was silenced in the model mice and the mice were fed blueberry juice. BJP is a model group, in which the model mice were fed blueberry juice and probiotics; BJPSI is a model group, in which SIRT1 gene was silenced in model mice and the mice were fed blueberry juice and probiotics. All data are presented as mean value ± SD and n=8 in each group. *P<0.05 vs control group and #P<0.05 vs MG. ANOVA was performed to compare the mean values from different groups.
Abbreviations: BAX, BCL2-associated X protein; Bcl-2, B-cell lymphoma 2; RT-PCR, reverse transcription-polymerase chain reaction; CG, control group; MG, model group; BJ, blueberry juice group; SI, SIRT1 siRNA group; SIRT1, sirtuin type 1; BJSI, blueberry juice and SIRT1 siRNA group; BJP, blueberry juice and probiotic bacteria group; BJPSI, blueberry juice, probiotics, and SIRT1 siRNA group; FOXO1, forkhead box protein O1; FasL, tumor necrosis factor ligand superfamily member 6; SD, standard deviation.

