
Figure 1.
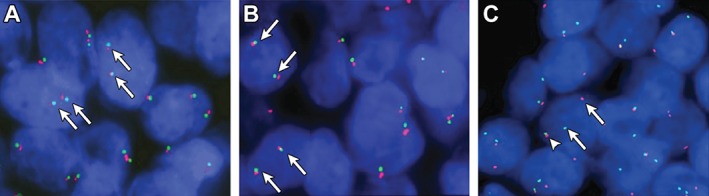
(A, B) FISH analysis of two inherited cylindromas, showing two non‐rearranged copies of MYB in each cell nucleus (fused red/green signals indicated by arrows). (C) FISH analysis of a MYB–NFIB fusion‐positive adenoid cystic carcinoma (control) with a split MYB signal consistent with a MYB gene fusion; arrows, separated red and green signals; arrowhead, intact MYB allele