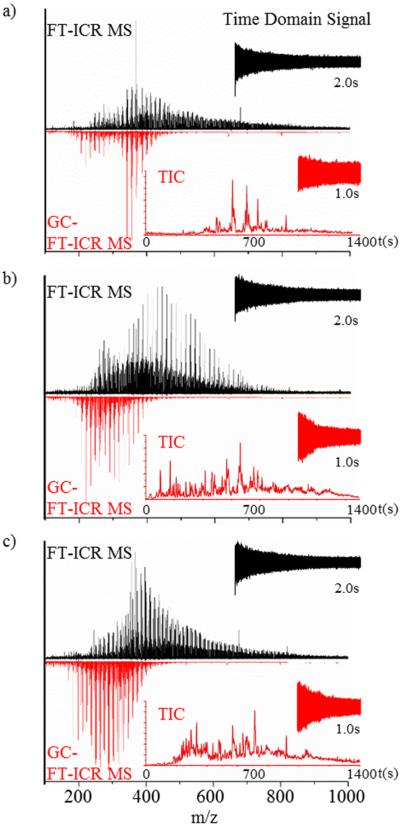
Figure 1.
Typical FT-ICR MS spectra of (a) petroleum crude oil (PCO), (b) organics in shale oil (OSO), and (c) heavy sweet crude oil (HSO) obtained by direct-infusion APLI-FT-ICR MS (top, black spectrum) and GC-APLI-FT-ICR MS (bottom, red spectrum). Also shown is the time domain signal for the direct-infusion analysis (black) and a single scan in the GC-FTMS analysis, along with the total ion chromatogram (red).

