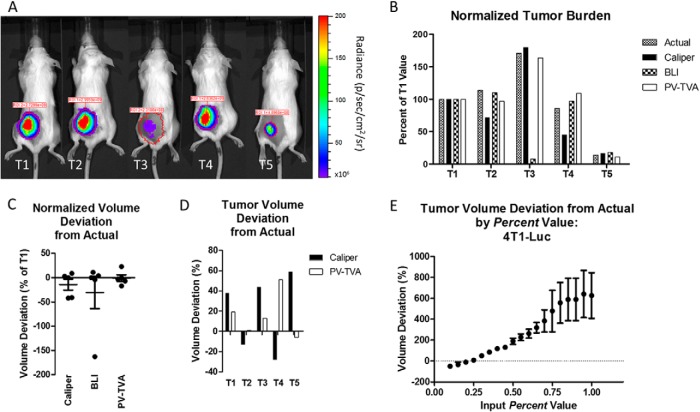
Figure 4.
BLI images for 5 4T1-Luc tumors (T1, T2, T3, T4, and T5) (A). Normalized tumor burden values for the actual volume, caliper, BLI, and the PV-TVA (B). All measurements were normalized to the T1 value for the specific type of measurement. The PV-TVA result was obtained using Percent = 0.25. Normalized tumor volume deviation from actual as a percentage of T1 for each method (C). Tumor volume percent deviation from the actual for the caliper and PV-TVA methods (D). Validation for the Percent value selected to calculate tumor volume using postmortem tumor volumes (E). The tumor volume deviations were calculated at various Percent values for the 4T1-Luc tumor model.

