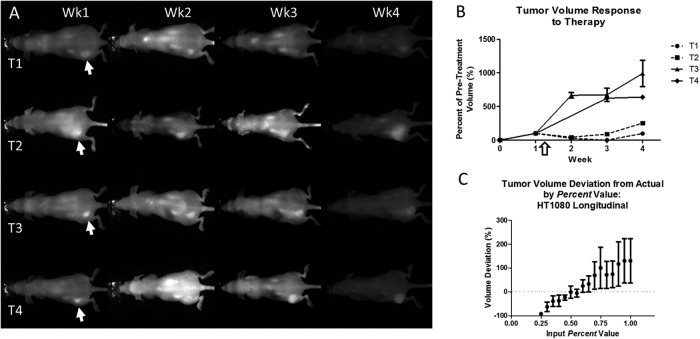
Figure 5.
NIR images of four HT1080 mice, with the left-flank tumors (T1, T2, T3, and T4) indicated by the arrows (A). Each mouse was imaged once a week for 4 weeks. Images had different tumor signals, average mouse signals, and tumor-to-mouse contrast. Tumor volumes, over time, normalized to the pretreatment volume. Doxorubicin-treated mice (dashed line) showed suppressed tumor growth compared with the control mice following the administered dose (white arrow) (B). Validation for the Percent value used in the HT1080 longitudinal treatment study after multiple fluorophore injections over time (Percent = 0.55) (C).

