Figure 4.

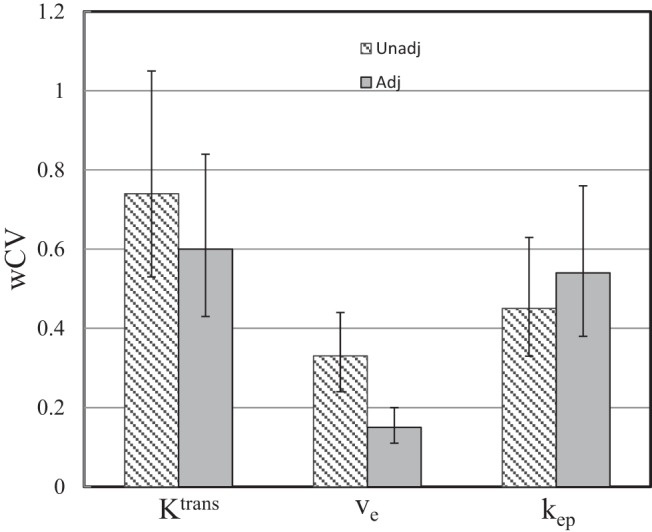
Column graphs of wCV for the Ktrans, ve, and kep parameters obtained with the unadjusted (unadj., shaded light gray) and adjusted (adj., dark gray) AIFs. The respective 95% confidence intervals (CIs) are shown as error bars.

Column graphs of wCV for the Ktrans, ve, and kep parameters obtained with the unadjusted (unadj., shaded light gray) and adjusted (adj., dark gray) AIFs. The respective 95% confidence intervals (CIs) are shown as error bars.