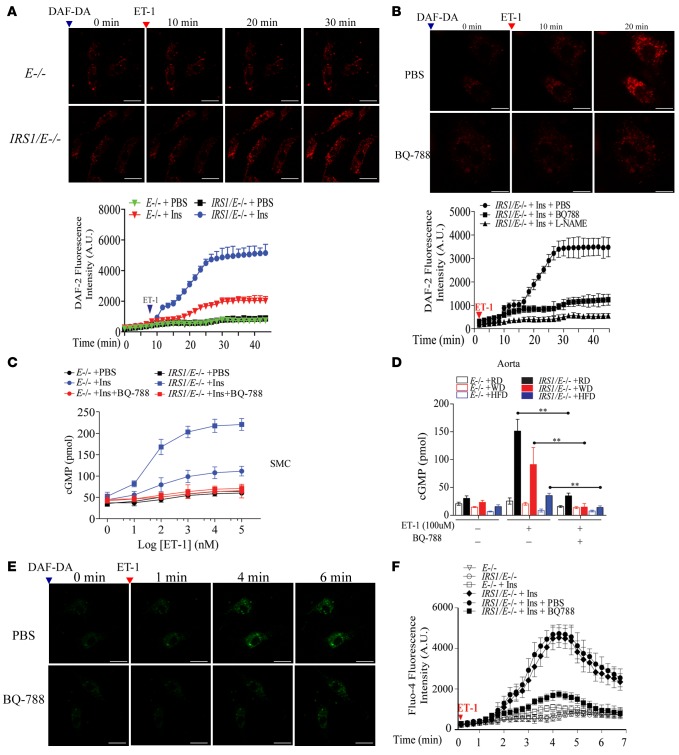
Figure 6. NO production in EC from Irs1/Apoe–/– mice and its relationship to EDN1 and EDNRB.
(A) EDN1-induced NO production in the aortic EC from Irs1/Apoe–/– and Apoe–/– mice. NO production was visualized by DAF-2DA fluorescence intensity (FI) and quantified. Original magnification, ×15; scale bar: 5 μm. (B) EDN1-induced NO production in insulin-stimulated aortic EC from Apoe–/– and Irs1/Apoe–/– mice pretreated with BQ-788 (0.1 mM) or L-NAME (0.5 mM). NO production was visualized by DAF-2DA and quantified. Original magnification, ×20; scale bar: 5 μm. (C) Nω-nitro-L-arginine–sensitive accumulation of cGMP in VSMC from Apoe–/– and Irs1/Apoe–/– mice stimulated with EDN1 pretreated with BQ-788 or L-NAME. (D) Accumulation of cGMP in aortas from WD- or HFD-fed Apoe–/– and Irs1/Apoe–/– mice. (E and F) Ca2+ accumulation was visualized and quantified by Fluor-4 in EC. Original magnification, ×15; scale scale bar: 5 μm. Data are represented as mean ± SEM of at least 5 cellular replicates for NO production experiments in EC and cGMP experiments in VSMC. **P < 0.01 (3-way ANOVA for multiple comparisons involving 3 factorial variables and 2-tailed Student’s t test for pairwise comparisons).

