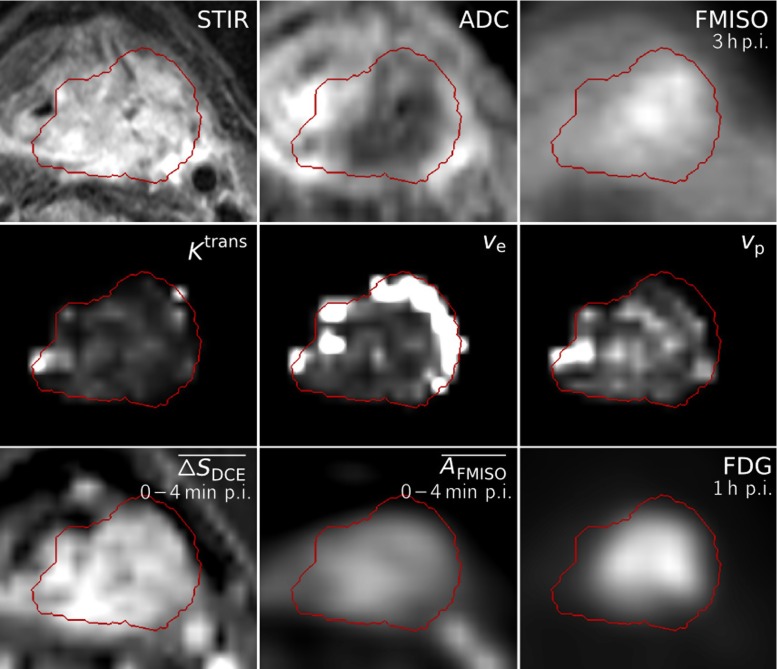
Fig. 1.
Dataset of Patient 11, showing transversal slices of the anatomical T2-weighted image (STIR), ADC map, FMISO image at 3 h p.i., the DCE-derived maps K trans, v e and v p, the maps of mean signal enhancement and mean FMISO activity in the time range of 0–4 min p.i, and the FDG image at 1 h p.i. All images and parameter maps were acquired in a single PET/MRI session, except for the FDG image and the map which were transferred to the PET/MR dataset by deformable registration. The delineation of the GTV is shown in red

