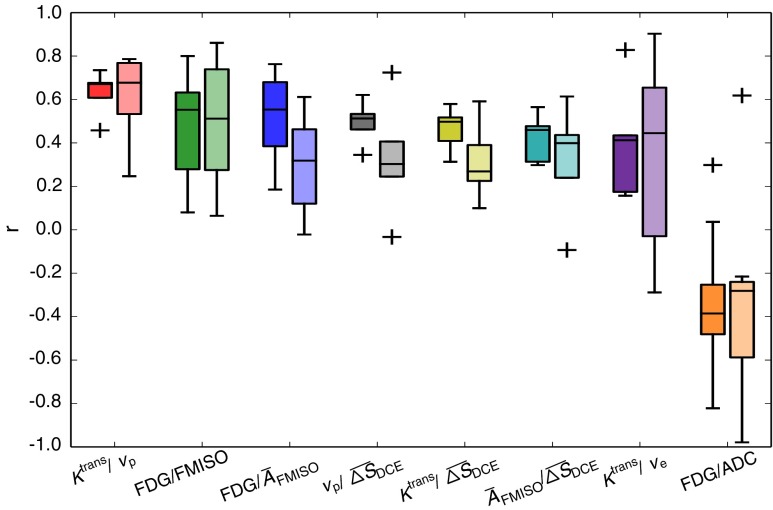
Fig. 4.
Boxplots showing the inter-patient variation of Spearman correlation coefficients for the pairs with the median voxel correlations according to Fig. 3. For each functional pair, the results from voxel-based analysis (dark color, left boxes) and from regional analysis (light color, right boxes) are shown

