Fig. 5.

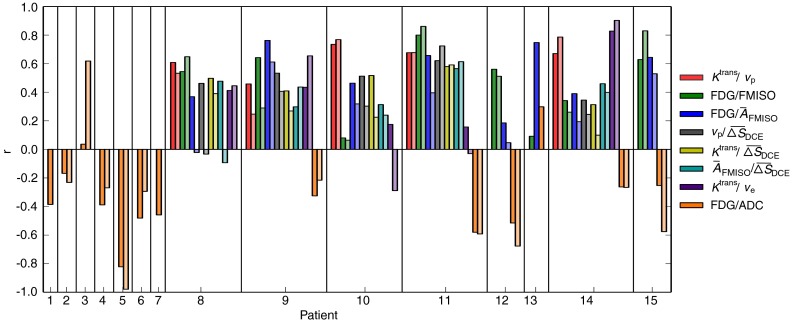
Spearman correlation coefficients obtained for the individual patients. Color encoding is the same as in Fig. 4, with dark and light colors showing the results from voxel-based and regional analysis, respectively

Spearman correlation coefficients obtained for the individual patients. Color encoding is the same as in Fig. 4, with dark and light colors showing the results from voxel-based and regional analysis, respectively