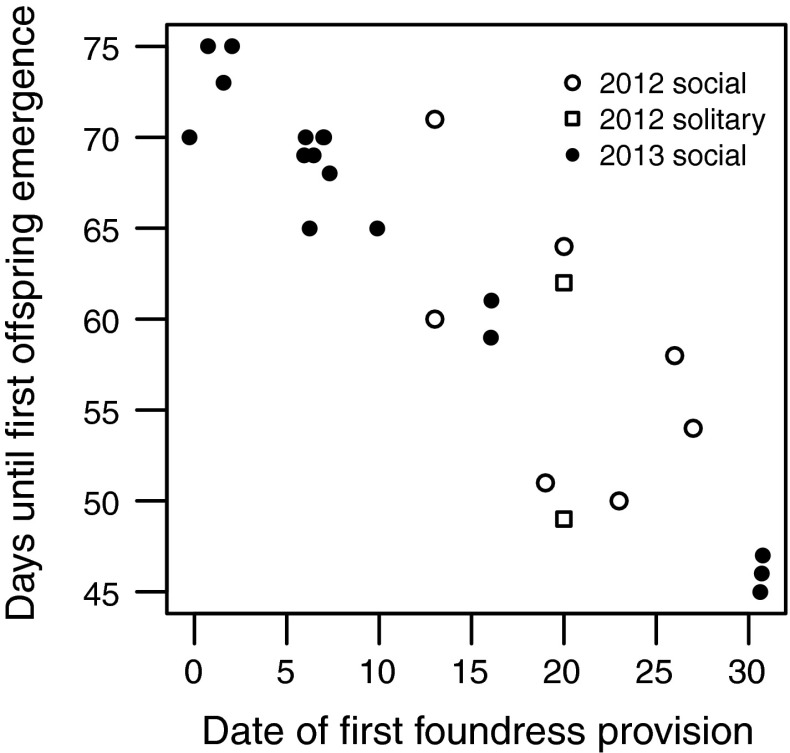
Fig. 3.
Relationship between the date on which a foundress first provisioned and the number of days until her first B1 offspring emerged. Data are shown for both years. Open symbols are data from 2012: circles show nests where offspring became social, and squares show nests that were probably solitary. Filled circles are data from 2013. The later a foundress began provisioning, the shorter the time before her first offspring emerged. Day 0 is April 30. Individual points are horizontally jittered to show overlapping data

