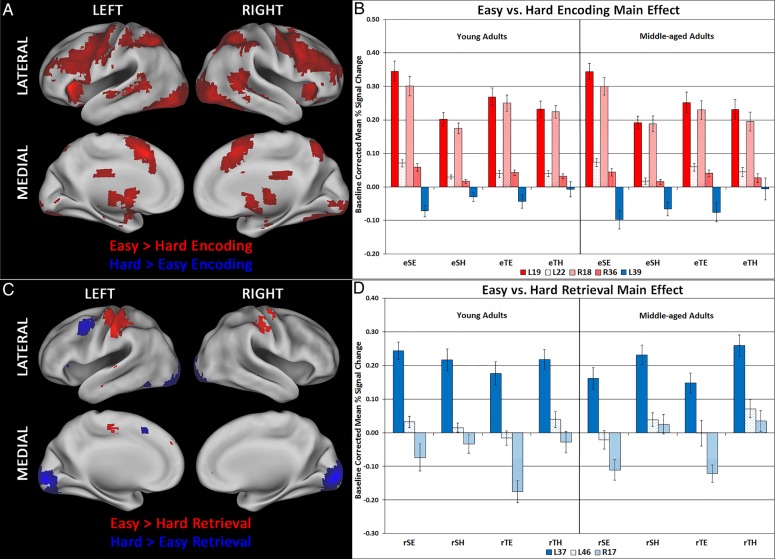
Figure 2.
(A) The singular image for Contrast 4, Easy > Hard Encoding, at a bootstrap ratio of ±3.28 (P < 0.001), which reflects reliable activations at time lags 2–4. Red regions were activated to a greater extent during easy > hard encoding. A single small region (BA39) showed the opposite effect; this region did not display using Caret software. (B) Bar graph representing mean activation with standard error bars in regions of interest in this contrast. (C) The singular image for Contrast 5, Easy > Hard Retrieval, at a bootstrap ratio of ±3.28 (P < 0.001), which reflects reliable activations at time lags 2–4. Red regions were activated to a greater extent in Easy > Hard Retrieval, while blue regions showed the opposite effect. (D) Bar graph representing mean activation with standard error bars in regions of interest in this contrast. Regions are identified by their hemisphere and Brodmann area. L, left; R, right; eSE, easy spatial encoding; eSH, hard spatial encoding; eTE, easy temporal encoding; eTH, hard temporal encoding; rSE, easy spatial retrieval; rSH, hard spatial retrieval; rTE, easy temporal retrieval; rTH, hard temporal retrieval.

