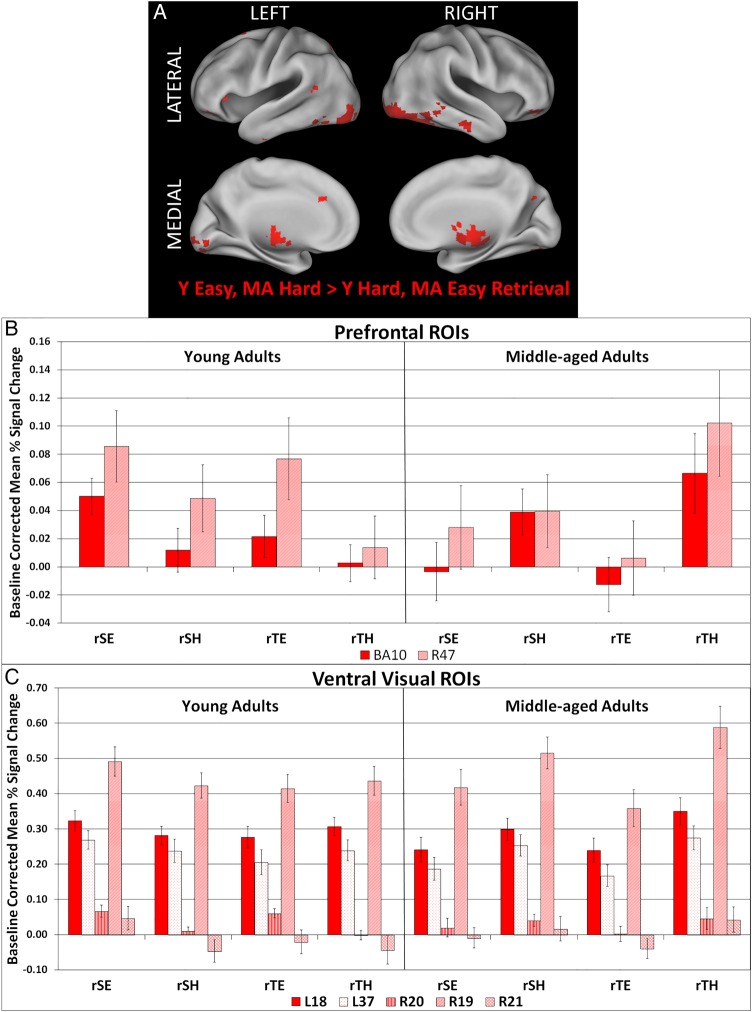
Figure 3.
(A) The singular image for Contrast 10, group-by-easy > hard retrieval interaction, at a bootstrap ratio of ±3.28 (P < 0.001), which reflects reliable activations at time lags 2–4. (B,C) Bar graphs representing mean activation with standard error bars in regions of interest (ROIs) that exhibited an encoding > retrieval interaction in young > middle aged adults. Regions are identified by their hemisphere and Brodmann area. L, left; R, right; eSE, easy spatial encoding; eSH, hard spatial encoding; eTE, easy temporal encoding; eTH, hard temporal encoding; rSE, easy spatial retrieval; rSH, hard spatial retrieval; rTE, easy temporal retrieval; rTH, hard temporal retrieval.

