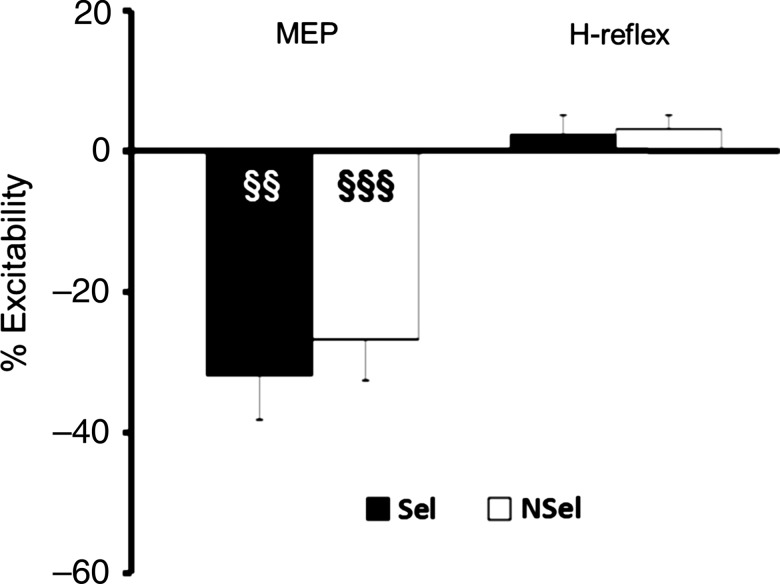
Figure 4.
Measure of corticospinal and spinal excitability (Experiment 2). TMS and PNS, eliciting MEPs and H-reflexes, respectively, were applied 250 ms after the preparatory cue. Values are represented as percentage of baseline. Black bars are for trials in which the right hand was selected (Sel) and white bars are from nonselected trials (NSel). Error bars represent standard errors. §§P < 0.01, §§§P < 0.001: different from 0.

