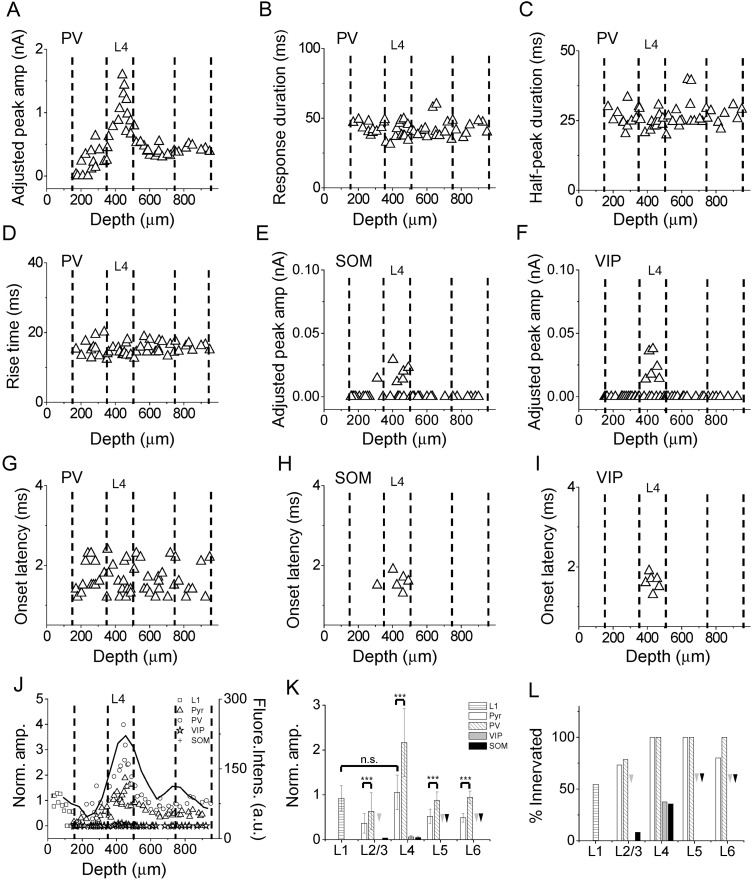
Figure 4.
Laminar patterns of thalamocortical responses in A1 inhibitory neurons. (A) Distribution of adjusted peak amplitudes of thalamocortical responses recorded in PV neurons along cortical depth. Each data point represents one cell. (B) Distribution of response durations of thalamocortical responses in PV neurons. F = 0.499, P = 0.685, ANOVA test. (C) Distribution of half-peak durations for PV neurons. F = 0.877, P = 0.461, ANOVA test. (D) Distribution of response rise times for PV neurons. F = 0.851, P = 0.474, ANOVA test. (E) Distribution of adjusted peak amplitudes for SOM neurons. (F) Distribution of adjusted peak amplitudes for VIP neurons. (G) Distribution of onset latencies for PV neurons. F = 1.579, P = 0.207, ANOVA test. (H) Distribution of onset latencies for SOM neurons. (I) Distribution of onset latencies for VIP neurons. (J) Normalized amplitudes for different cell types. The adjusted amplitudes were normalized to the global average amplitude of L4 excitatory neuron responses. The black curve represents the laminar distribution of fluorescence intensity (in arbitrary unit) of thalamocortical axon fibers. (K) Average normalized peak amplitudes of different cell types in different layers. Arrows point to zero values. ***P < 0.001, t-test. (L) Percentage of cells exhibiting thalamocortical responses. Arrows point to zero values. L1 cell (12/ 22); Pyramidal cell (11/15 in L2/3; 18/18 in L4; 12/12 in L5; 8/10 in L6); PV cell (11/14 in L2/3;13/13 in L4; 15/15 in L5; 8/8 in L6); VIP cell (0/17 in L2/3; 6/16 in L4; 0/10 in L5; 0/6 in L6); SOM cell (1/12 in L2/3; 5/14 in L4; 0/10 in L5; 0/6 in L6).

