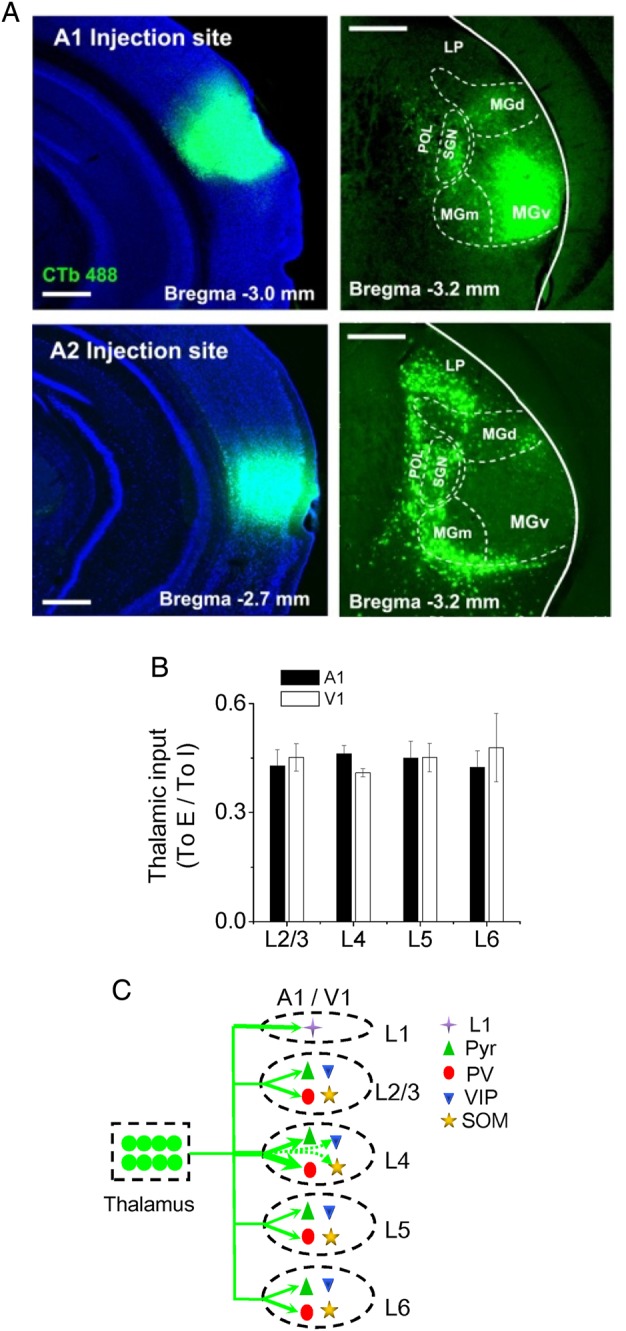
Figure 6.

Summary of thalamocortical innervation of A1 and V1 neurons. (A) Top, image of CTb fluorescence in the injected site (in A1) (left) and retrogradely labeled neurons in the thalamus. Boundaries for some thalamic divisions are marked. Scale: 500 µm. LP: lateral posterior nucleus. SG: suprageniculate nucleus. POL: posterior limiting nucleus. MGd, MGm, MGv: dorsal, medial, and ventral part of the MGB respectively. (B) Ratio of strength of thalamocortical innervation of a pyramidal vs. a PV cell in the same layer. Average values were obtained by bootstrap sampling (1000 times, see Materials and Methods). Bar = SD. There are no significant differences between any 2 layers in either A1 or V1 (ANOVA test). (C) Schematic graph to summarize thalamocortical innervation patterns in the A1 and V1. The thickness of the green arrow indicates the innervation strength. Arrows with dashed lines represent the weakest connections.
