

Abstract
C-tactile (CT) afferents encode caress-like touch that supports social–emotional development, and stimulation of the CT system engages the insula and cortical circuitry involved in social–emotional processing. Very few neuroimaging studies have investigated the neural mechanisms of touch processing in people with autism spectrum disorder (ASD), who often exhibit atypical responses to touch. Using functional magnetic resonance imaging, we evaluated the hypothesis that children and adolescents with ASD would exhibit atypical brain responses to CT-targeted touch. Children and adolescents with ASD, relative to typically developing (TD) participants, exhibited reduced activity in response to CT-targeted (arm) versus non-CT-targeted (palm) touch in a network of brain regions known to be involved in social–emotional information processing including bilateral insula and insular operculum, the right posterior superior temporal sulcus, bilateral temporoparietal junction extending into the inferior parietal lobule, right fusiform gyrus, right amygdala, and bilateral ventrolateral prefrontal cortex including the inferior frontal and precentral gyri, suggesting atypical social brain hypoactivation. Individuals with ASD (vs. TD) showed an enhanced response to non-CT-targeted versus CT-targeted touch in the primary somatosensory cortex, suggesting atypical sensory cortical hyper-reactivity.
Keywords: affective touch, autism spectrum disorder, functional magnetic resonance imaging, insula, sensory hyper-reactivity, tactile perception
Introduction
Autism spectrum disorder (ASD) is characterized by persistent deficits in social communication and social interaction across multiple contexts and restricted, repetitive patterns of behavior, interests, or activities (American Psychiatric Association 2013). The newest (5th) edition of the Diagnostic and Statistical Manual of Mental Disorders (DSM-5), featured the addition of “hyper- and hypo-reactivity to sensory input or unusual interests in sensory aspects of the environment” as defining features of ASD. Individuals with ASD often report tactile sensitivities such as stiffening or pulling away when touched (Grandin 1989; Kern et al. 2007). Infants who develop ASD display greater touch aversion than typically developing (TD) or otherwise developmentally delayed peers (Baranek 1999). Touch therapies have been widely implemented (Field et al. 1997) but empirical evaluation is rare (American Academy of Pediatrics 2012).
C-tactile (CT) afferents, existing solely in the hairy skin of mammals, process slow, gentle, caress-like touch (Kumazawa and Perl 1977; Vallbo et al. 1993; Essick et al. 1999; McGlone et al. 2007; Löken et al. 2009; Morrison et al. 2010). Olausson et al. (2002) identified CT afferents in a patient who lacked myelinated A-beta nerves, which normally function in discriminative tactile sensation, and showed that stimulation of CT afferents elicited activation in the insular cortex. These findings led to the “skin as a social organ” hypothesis (Morrison et al. 2010), which posits that the CT system might represent an evolutionarily conserved mechanism for processing affective, or limbic touch (Olausson et al. 2002; McGlone et al. 2014). Recent functional magnetic resonance imaging (fMRI) (Voos et al. 2012; Gordon et al. 2013) and functional near-infrared spectroscopy (fNIRS) (Bennett et al. 2014) studies support this hypothesis, demonstrating “social brain” (Brothers 1990) involvement in processing gentle touch. The insula, posterior superior temporal sulcus (pSTS) region, medial prefrontal cortex (mPFC), amygdala, and ventrolateral prefrontal cortex (vlPFC) preferentially respond to CT-targeted versus non-CT-targeted touch (Gordon et al. 2013). These same brain regions play a role in social cognition and are dysfunctional in individuals with ASD (Dapretto et al. 2006; Kaiser et al. 2010). A second fMRI study of TD adults, comparing the brain responses to slow (CT-targeted) and fast (non-CT-targeted) touch to the arm, revealed a robust negative correlation between the responses of the pSTS and orbitofrontal cortex to CT-targeted touch and individual autistic traits (Voos et al. 2012). These studies document the involvement of the neural systems supporting social cognition in processing gentle CT-afferent-mediated touch and highlight a potential link between the CT-afferent system and ASD.
In the current study, we compared brain responses to CT-targeted (forearm brush stroking) and non-CT-targeted (palm brush stroking) touch in 19 TD children and adolescents and 19 age-, IQ-, and head-motion-matched individuals with ASD via fMRI (see Table 1 for the relevant means and statistics). We compared palm and forearm brush stroking because CT afferents innervate the forearm, but do not innervate the palm. We hypothesized that children and adolescents with ASD, relative to TD peers, would exhibit atypical brain responses to affective touch to the forearm (CT-targeted) versus the palm (non-CT-targeted). Specifically, we predicted hypoactivation in participants with ASD (vs. TD) in the network of brain regions associated with the social brain that are sensitive to affective touch (insula, right pSTS, mPFC, amygdala, and vlPFC) in response to CT-targeted versus non-CT-targeted touch. Recent work supporting this hypothesis demonstrated that, in individuals with ASD, social impairment was positively correlated with tactile defensiveness in bodily sites associated with social touch, which suggests a clinically relevant distinction between social and discriminative touch in ASD (Cascio et al. 2013). In addition, given that the palm of the hand (vs. arm) is more densely innervated with connections to the primary somatosensory cortex (S1) (e.g., Penfield and Rasmussen 1950), we hypothesized that palm versus arm touch would activate S1. We explored whether activation between the two groups of participants differed in this region.
Table 1.
Characterization data
| Variable | TD | ASD | P-value |
|---|---|---|---|
| N | 19 | 19 | |
| Age range | 5.56–17.05 | 6.43–20.26 | |
| Mean age (SD) | 12.66 (2.90) | 12.41 (4.20) | 0.831 |
| Verbal IQ | 105.05 (16.88) | 95.68 (23.17) | 0.163 |
| Nonverbal IQ | 101.16 (16.92) | 96.11 (23.68) | 0.441 |
| General conceptual ability IQ | 103.47 (17.70) | 96.05 (21.73) | 0.256 |
| ADI-R (N = 18) | |||
| Social | N/A | 22.17 (4.59) | |
| Verbal communication | N/A | 17.44 (4.34) | |
| Repetitive | N/A | 5.83 (2.28) | |
| ADOS module 3 (N = 16) | |||
| Social affect | N/A | 11.06 (3.97) | |
| Repetitive behaviors | N/A | 2.56 (1.50) | |
| Total | N/A | 13.63 (3.98) | |
| ADOS module 4 (N = 3) | |||
| Communicative | N/A | 3.33 (.58) | |
| Social interaction | N/A | 8.33 (.58) | |
| Total | N/A | 11.67 (.58) | |
| Head motion—mean displacement (absolute), mm | 0.19 (0.11) | 0.32 (0.32) | 0.117 |
| Head motion—mean displacement (relative), mm | 0.06 (0.03) | 0.08 (0.05) | 0.155 |
Materials and Methods
Participants
We studied a group of 19 children and adolescents with ASD (16 males, ages 6.43–20.26 years, M = 12.41 ± 4.20 years) and 19 TD children and adolescents (9 males, ages 5.56–17.05 years, M = 12.66 ± 2.90 years) who were all right handed. The 2 groups were matched on age and cognitive ability—as measured by the Differential Abilities Scales (Elliott 1990) as well as motion characteristics (see Table 1). All individuals with ASD met DSM-5 criteria for ASD based on a history of clinical diagnosis of ASD/autistic disorder, expert clinical evaluation, parental interview (Autism Diagnostic Interview-Revised) (Lord et al. 1994), and observational assessment of the affected individual (Autism Diagnostic Observation Schedule) (Lord et al. 2000). Clinical characterization information for the TD and ASD groups is summarized in Table 1.
Prescan Questionnaire and Ratings
Prior to the scan, an experimenter brushed participants with a fine hair paintbrush on the right arm and palm in the same manner that they would be brushed during the fMRI scan. For the arm (CT-targeted) and palm (non-CT-targeted) separately, we asked participants to indicate if they felt the touch (all participants indicated that they had). Then, participants were asked to indicate how pleasant they would rate the touch to the arm and palm separately on a visual Likert scale (1 = “Hate it,” 2 = “Would rather avoid it,” 3 = “OK,” 4 = “Like it,” 5 = “Love it”). Instead of numbers, the Likert scale utilized pictures ranging from a cartoon frowning a lot (Hate it) to a cartoon smiling a lot (Love it). This scale was adapted from the Self-Assessment Manikin scale, used to rate the affective dimensions of valence (Bradley and Lang 1994).
To facilitate the acquisition of high-quality neuroimaging data, free of motion artifacts, we implemented an individualized training protocol to accustom participants to the scanner environment as well as to provide training and reinforcement for compliance with the requirement to remain very still during fMRI. We utilized the following training procedures: 1) preparation for scanning through videos sent home before the visits; 2) preparation for use of earphones and earplugs in the scanner by sending home earphones and earplugs and asking parents to help their children learn to wear them properly for increasing periods of time; 3) providing a list of games for parents to engage their children in at home before and between the training protocol sessions, allowing children an opportunity to earn rewards for holding still for increasing lengths of time; 4) gradual introduction to experimental procedures through interaction with, first, a “toy” scanner used on a stuffed animal, then a mock scanner before entering the scanning environment; 5) helping participants become familiar and comfortable with the brush stroking prior to the fMRI scan by providing examples of the touch in the mock scanner; 6) using picture schedules to accompany mock scanner sessions and as reminders prior to the scanning session; 7) utilizing visual transition signals between “statue/picture taking” and “move” conditions; 8) providing comforting activities and rewards to assist children in overcoming distress, along with parental support.
Experimental Design
As in our prior adult study (Gordon et al. 2013), participants received continuous brushing (back and forth) to the right palm (non-CT-targeted) or forearm (CT-targeted) in a block design procedure. The 2 experimental conditions (Arm, Palm) alternated, and there were 16 repetitions (8 rep. for Arm, 8 rep. for Palm) of 6-s periods of touch followed by 12 s of rest (no touch). Prior to the beginning of the scan, we marked 8 cm on the arm and 4 cm on the palm in order to control for the length of area brushed. Tactile stimuli were slow strokes (8 cm/s) with a 7-cm wide watercolor brush administered by a trained experimenter. The brush stroke velocity was selected based on previous research indicating that 8 cm/s is optimal for targeting CT afferents (Löken et al. 2009). An experimenter instructed participants to close their eyes during the procedure, to remain very still, and to focus on the touch they experienced. Three trained experimenters administered the brushing procedure (the experimenters were counterbalanced across TD and ASD groups). During each scan, the experimenter monitored the participant's eyes to confirm that they were closed for the duration of the experiment.
Imaging Protocol
Images were collected on a Siemens 3T Tim Trio scanner located in the Yale University Magnetic Resonance Research Center. High-resolution T1-weighted anatomical images were acquired using an MPRAGE sequence (repetition time [TR] = 1900 ms; Echo Time [TE] = 2.96 ms; flip angle = 9°; Field of View [FOV] = 256 mm; matrix = 256 mm2; voxel size = 1 mm3; number of slices = 160). Whole-brain functional images were acquired using a single-shot, gradient-recalled echo planar pulse sequence (TR = 2000 ms; TE = 25 ms; flip angle = 60°; FOV = 220 mm; matrix = 64 mm2; voxel size = 3.44 × 3.44 × 4.00 mm; number of slices = 34) sensitive to blood oxygen level–dependent (BOLD) contrast. Runs consisted of the acquisition of 153 successive brain volumes.
fMRI Analysis
The imaging data were processed and analyzed using the fMRI Feat Analysis Tool (FEAT) of FSL, via a data processing pipeline implemented in the Yale University High-Performance Computing clusters. The pipeline consisted of: 1) rigid-body head-motion correction using MCFLIRT, 2) interleaved slice timing correction, 3) Brain Extraction Tool (BET) brain extraction, 4) spatial smoothing using a kernel of full width at half maximum 5 mm, 5) high-pass temporal filtering using 100 s. Individual Echoplaner Imaging datasets that were registered to the subject's structural scan (with the brain extracted using BET) and then registered to the MNI152 standard brain. Artifact removal was performed with FSL's FIX tool (FMRIB's ICA-based Xnoiseifier) (Salimi-Khorshidi et al. 2014) and bad components (such as movement-related components, white matter fluctuations, susceptibility-related artifacts, cardiac pulsation, major veins, etc.) were manually identified via FSL's MELODIC ICA tool by trained laboratory staff who were blinded to subject diagnostic status, conditions, and the hypotheses of this experiment. General Linear Model-based analyses were conducted for each participant to assess task-related BOLD responses.
Whole-Brain Analyses
To create predictors for the Arm and Palm conditions, the timing of the corresponding blocks (onset in seconds, duration = 6 s, weighting = 1) was convolved with the default gamma function (phase = 0 s, standard deviation = 3 s, mean lag = 6 s) with temporal derivatives. Time series autocorrelation was estimated using FSL's FILM prewhitening tool. Thresholding at the individual level was implemented through cluster analysis, voxel-level threshold Z > 1.96, P < 0.05, two-sided, and whole-brain corrected cluster-level threshold P < 0.05. The individual-level parameter estimates were inputs for the group-level fMRI analyses. All group-level fMRI analyses were conducted using FSL's FMRIB's local analysis of mixed-effects (FLAME) 1 + 2 inference algorithm, while correction for multiple comparisons was performed using a voxel-level threshold of Z > 1.96 and a cluster-level threshold of P < 0.05. Age was controlled for as a covariate of no interest across all analyses to account for any confounding effects due to age, although the results did not change when age was not controlled for in the analyses.
Functional Connectivity Analyses
We conducted psychophysiological interaction (PPI) analyses (McLaren et al. 2012) using FEAT to examine task-related functional connectivity of 1) right insula as anatomically defined in the Harvard–Oxford cortical structural atlas in FSL (Jenkinson et al. 2012), and 2) right pSTS as anatomically defined in the Desikan-Killiany cortical atlas (i.e., the rh.bankssts). We selected these regions because the insula represents a key region for processing affective touch, the pSTS is a key central node of social information processing, and the right lateralization of social functions is well established (Yang et al. 2015). Furthermore, we chose to use anatomical regions of interest as seeds to avoid bias that might be introduced by using seeds derived from the regions of fMRI activation found within this study. In both PPI analyses, at first level, the psychological regressors of interest were the timings of Arm and Palm, respectively, convolved with a hemodynamic response function. The physiological regressor was calculated as the mean time series of the seed region, namely, the right insula and pSTS, respectively. The PPI regressors were the interaction terms between the psychological and physiological regressors, namely (Arm × physiological) and (Palm × physiological), and the contrast of interest, (Arm × physiological) versus (Palm × physiological). These were estimated for each participant, to determine which brain regions work together with the seed region during the Arm as opposed to the Palm condition. Next, the group-level analyses tested the contrast of interest for TD > ASD and ASD > TD, separately, while participants' age was included as a covariate of no interest.
Brain–Behavior Correlation Analyses
Exploratory analyses examined the relationship between the brain response to CT-targeted touch and individual differences in the severity of autism symptoms. Across the whole brain, we sought to determine whether the differential response to Arm and Palm touch correlated with individual differences in autistic symptomology (as measured by the Autism Diagnostic Observation Schedule [ADOS] Calibrated Severity Scores [CSS]).
Results
First, to evaluate group differences in pleasantness ratings, we conducted a repeated-measures two-way analysis of variance of touch location (Arm vs. Palm) and group (TD vs. ASD). TD ratings were Arm (M = 3.53, SD = 0.96) and Palm (M = 3.74, SD = 0.65). ASD ratings were Arm (M = 4.17, SD = 0.71) and Palm (M = 3.94, SD = 0.87). There was no main effect of touch location, nor was there an interaction effect between touch location and group, P’s > 0.10. However, the main effect of group showed a trend suggesting that the ASD group tended to rate both kinds of touch as more pleasant than the TD group (M’s = 4.06 vs. 3.63), F1, 35 = 3.45, P = 0.07, which is consistent with previous findings (Cascio et al. 2008). Across the 2 groups, males and females did not differ on the pleasantness ratings for Arm, t(35) = −0.81, P = 0.43, or Palm, t = −0.05, P = 0.96.
To assess each group's differential whole-brain responses to the 2 brushing conditions, we directly compared the response with Arm and Palm touch in the TD and ASD groups, separately. We were particularly interested in comparing Arm versus Palm brush stroking because CT afferents innervate the arm but not the palm. As illustrated in the left-hand panel of Figure 1 (orange-to-yellow color map), TD children and adolescents exhibited Arm > Palm activity in the bilateral insular cortex extending into the vlPFC and the temporal poles as well as the right pSTS, right amygdala, and right fusiform gyrus (FG), generally replicating our previous findings from TD adults (Gordon et al. 2013; Bennett et al. 2014). Palm > Arm activity (blue-to-light blue color map) was localized to the expected location of S1. While the children and adolescents with ASD exhibited Palm > Arm activity in S1 (right-hand panel of Fig. 1), they lacked the Arm > Palm activity, identified in TD participants in the right pSTS, bilateral temporoparietal junction (TPJ) extending into the inferior parietal lobule (IPL), right FG, right amygdala, bilateral insula, and vlPFC. Table 2 lists by group the peak coordinates, effect sizes, regional extent, and anatomical labels for the regions of differential activation to Arm and Palm touch.
Figure 1.

Whole-brain results from a contrast of (Arm > Palm) (orange-to-yellow color map) and (Palm > Arm) (blue-to-light blue). The TD group is represented on the left and the ASD group on the right. Left-hand panel: TD children and adolescents exhibited Arm > Palm (orange-to-yellow color map) activity in bilateral insular cortex extending into the ventrolateral prefrontal cortices (vlPFC) and the temporal poles as well as the right posterior superior temporal sulcus (pSTS), right amygdala, and right fusiform gyrus (FG). Palm > Arm activity (blue-to-light blue color map) was localized to the expected location of the primary somatosensory cortex (S1). While the children and adolescents with ASD shared Palm > Arm activity in the S1 (right-hand panel), they lacked Arm > Palm activity in the right pSTS, bilateral temporoparietal junction (TPJ) extending into the inferior parietal lobule (IPL), right FG, right amygdala, bilateral insula, and vlPFC, identified in TD participants. We controlled for age as a covariate of no interest. These results were estimated using FSL's mixed-effects algorithm (FLAME1 + 2) and corrected for multiple comparisons at a voxel-level threshold Z> 1.96, cluster-level threshold P < 0.05.
Table 2.
Results of (Arm > Palm) and (Palm > Arm) contrasts by group
| Cluster | # of voxels | Local maxima |
||||
|---|---|---|---|---|---|---|
| Approx. region | x | y | z | Z-score | ||
| TD: Arm > Palm | ||||||
| 1 | 20 192 | R supramarginal gyrus | 58 | −44 | 20 | 4.39 |
| R precentral gyrus | 38 | −12 | 48 | 4.35 | ||
| R inferior frontal gyrus | 50 | 18 | −6 | 4.28 | ||
| R central opercular cortex | 60 | −14 | 16 | 4.26 | ||
| 2 | 942 | R juxtapositional cortex | 6 | 6 | 62 | 3.91 |
| L cingulate gyrus | −8 | −6 | 38 | 3.63 | ||
| 3 | 822 | R frontal pole | 6 | 60 | 20 | 3.78 |
| R superior frontal gyrus | 4 | 50 | 34 | 3.48 | ||
| TD: Palm > Arm | ||||||
| 1 | 1774 | L postcentral gyrus | −42 | −30 | 56 | 5.83 |
| ASD: Arm > Palm | ||||||
| 1 | 1338 | Cuneal cortex | 2 | −80 | 38 | 3.61 |
| L lateral occipital cortex | −8 | −88 | 40 | 3.30 | ||
| L cingulate gyrus | −6 | −44 | 10 | 3.10 | ||
| 2 | 1237 | Superior frontal gyrus | 0 | 44 | 46 | 3.45 |
| Frontal medial cortex | 0 | 52 | −10 | 3.30 | ||
| Frontal pole | 2 | 56 | 22 | 3.13 | ||
| 3 | 949 | L paracingulate gyrus | −8 | 52 | −2 | 3.01 |
| L middle temporal gyrus | −60 | −14 | −16 | 3.68 | ||
| L temporal pole | −56 | 6 | −24 | 3.40 | ||
| ASD: Palm > Arm | ||||||
| 1 | 4834 | L postcentral gyrus | −42 | −30 | 56 | 9.67 |
| 2 | 992 | R postcentral gyrus | 48 | −32 | 58 | 4.73 |
| R superior parietal lobule | 42 | −38 | 60 | 3.79 | ||
| R supramarginal gyrus | 52 | −32 | 58 | 3.40 | ||
| 3 | 850 | R cerebellum | 18 | −50 | −22 | 6.22 |
The coordinates are in MNI152 space, mm.
As illustrated in Figure 2 (top), evaluation of the Group × Condition interaction identified regions where the ASD and TD groups displayed distinct differential responses to the Arm versus Palm conditions. Of primary interest were brain regions where the TD group uniquely exhibited an enhanced response to CT-targeted Arm relative to Palm touch including the bilateral anterior insula and insular operculum extending into vlPFC including cortex in the inferior frontal and precentral gyri, right pSTS, bilateral TPJ extending into the IPL, and right FG. There were no regions of significantly greater activity for the contrast ASD (Arm vs. Palm) > TD (Arm vs. Palm). The ASD (vs. TD) group exhibited an enhanced response to Palm versus Arm touch, localized to S1 and the left insula. There were no areas of TD (Palm vs. Arm) > ASD (Palm vs. Arm) activity. This pattern of results held when we controlled for gender (see Supplementary Fig. S1; interested readers may also see Supplementary Fig. S2 for the gender effect across the Arm and Palm conditions). Figure 2 (bottom) displays the percent signal change of the Arm and Palm conditions (vs. the baseline of rests periods) by group (ASD and TD). As seen in the bottom left panel, the TD group shows a stronger response to Arm versus Palm, t(18) = 4.28, P < 0.0001, whereas the ASD group shows a statistically identical response to both Arm and Palm, t(18) = −1.79, P = 0.09. In addition, the ASD group exhibits a stronger response to Palm, relative to the TD group, t(36) = 2.49, P = 0.02, while the TD group itself shows no response to Palm in these brain regions, t(18) = −0.02, P = 0.99. Conversely, as seen in Figure 2 (bottom, right), the somatosensory cortex and the left insula exhibit a very different pattern of effects, responding strongly to Palm versus Arm in the ASD group, t(18) = −9.72, P < 0.0001, but showing equivalent responses to Arm and Palm in the TD group, t(18) = 0.33, P = 0.75. Table 3 lists the peak coordinates, effect sizes, regional extent, and anatomical labels for the regions from the interaction analysis.
Figure 2.

Whole-brain results from contrasts of TD > ASD on (Arm > Palm) and ASD > TD on (Palm > Arm). Evaluation of the Group × Condition interaction identified regions where the ASD and TD groups displayed distinct differential responses to the (Arm > Palm) and (Palm > Arm) contrasts. Top, left: The TD group uniquely exhibited an enhanced response to CT-targeted Arm > Palm touch (orange-to-yellow color map) including the bilateral anterior insula and insular operculum extending into vlPFC, right pSTS, bilateral TPJ (extending into the IPL), and right FG. There were no significantly greater activations in the ASD (Arm > Palm) > TD (Arm > Palm) contrast. Top, right: The ASD group uniquely exhibited an enhanced response to non-CT-targeted Palm > Arm touch (blue-to-light blue color map) including primarily the S1. Age was controlled for as a covariate of no interest. The results were estimated using FSL's mixed-effects algorithm (FLAME1 + 2) and corrected for multiple comparisons at a voxel-level threshold Z > 1.96, cluster-level threshold P < 0.05. Bottom: Percent signal change of the Arm and Palm conditions versus the baseline of rest periods by group (TD and ASD) and on regions corresponding to the left and right top panels, respectively. Errors bars represent standard errors.
Table 3.
Interaction results of TD > ASD (Arm > Palm) and ASD > TD (Palm > Arm)
| Cluster | # of voxels | Local maxima |
||||
|---|---|---|---|---|---|---|
| Approx. region | x | y | z | Z-score | ||
| TD > ASD: Arm > Palm | ||||||
| 1 | 1553 | R central opercular cortex | 60 | −16 | 16 | 4.37 |
| R insular cortex | 38 | 10 | 0 | 3.70 | ||
| R temporal pole | 50 | 12 | −6 | 3.60 | ||
| 2 | 891 | L occipital pole | −8 | −92 | 24 | 3.41 |
| L lateral occipital cortex | −44 | −84 | 0 | 3.36 | ||
| 3 | 833 | R superior temporal gyrus | 46 | −30 | −2 | 3.67 |
| R middle temporal gyrus | 60 | −42 | 8 | 3.43 | ||
| R supramarginal gyrus | 58 | −38 | 8 | 3.30 | ||
| R inferior temporal gyrus | 46 | −54 | −10 | 2.92 | ||
| ASD > TD: Palm > Arm | ||||||
| 1 | 1095 | L postcentral gyrus | −52 | −24 | 54 | 4.61 |
| L supramarginal gyrus | −58 | −32 | 54 | 3.66 | ||
The coordinates are in MNI152 space, mm.
To further understand the nature of condition-by-group interactions, we conducted analyses of percent signal change of the condition (Arm or Palm) versus baseline (rests period) by group (ASD or TD) in key, structurally defined region of interests (ROIs). We chose to use anatomical ROIs to avoid bias that might be introduced by using ROIs derived from the regions of fMRI activation found within this study (i.e., to avoid the pitfalls of “double-dipping”). Specifically, we used 1) the right insula as anatomically defined in the Harvard–Oxford cortical structural atlas in FSL (Jenkinson et al. 2012), 2) the right pSTS as anatomically defined in the Desikan-Killiany cortical atlas (i.e., the rh.bankssts), 3) the left S1 (Brodmann areas 1, 2, 3), and 4) the right vlPFC as anatomically defined in the Harvard–Oxford cortical structural atlas (inferior frontal gyrus pars opercularis and inferior frontal gyrus pars triangularis). There were significant condition × group interaction effects for the right insula, F1,36 = 4.67, P < 0.05, right pSTS, F1,36 = 5.05, P < 0.05, and left S1, F1,36 = 9.44, P < 0.01, but not for the right vlPFC, F1,36 = 1.18, P = 0.29. As illustrated in Figure 3, the interaction effects in the right insula and the right pSTS regions were driven by a much stronger response to Arm touch (CT afferents) in the TD group relative to the ASD group [for the right insula, t(36) = −2.66, P = 0.01; for the right pSTS, t(36) = −2.14, P = 0.04], whereas the TD and ASD groups did not differ in these regions for Palm touch [for the right insula, t(36) = 0.08, P = 0.94; for the right pSTS, t(36) = 0.23, P = 0.82]. These results are consistent with our original hypotheses. For the left S1, the interaction effect was driven by a much stronger response to Palm touch (non-CT afferents) in the ASD group relative to the TD group, t(36) = 2.05, P < 0.05, whereas the 2 groups did not differ in this region for Arm touch, t(36) = −0.37, P = 0.71.
Figure 3.
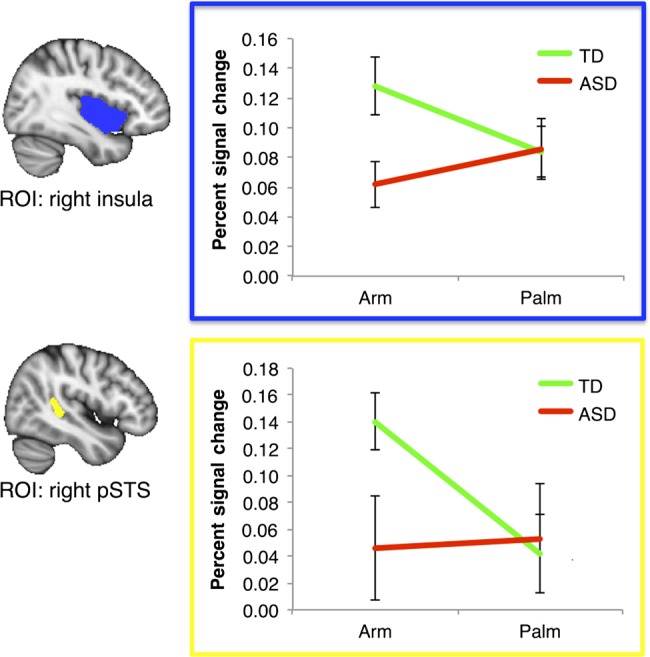
Percent signal change analyses of the (Arm or Palm) conditions versus the baseline of rest periods by group (TD or ASD). We used anatomically defined right insular cortex (top, outlined in blue) and right pSTS (bottom, outlined in yellow) as region of interests (ROIs). In both ROIs, it is primarily Arm (vs. rests), but not Palm (vs. rests), that drives the TD > ASD difference. Errors bars represent standard errors.
Having addressed our core research hypotheses, we sought to explore patterns of functional connectivity from some of the key regions of interest (right pSTS and right insula) that exhibited abnormal levels of activation to social touch in ASD. As shown in Figure 4, a group-level model of the PPI estimates revealed that TD (Arm vs. Palm) > ASD (Arm vs. Palm) had significantly greater functional connectivity from the right insula to the ventromedial prefrontal cortex (vmPFC) and to the bilateral paracentral lobules as well as from the right pSTS to the right amygdala extending into the hippocampus and the anterior section of the right superior, middle, and inferior temporal cortices, extending into the right FG. There were no significant ASD (Arm vs. Palm) > TD (Arm vs. Palm) differences in functional connectivity. Moreover, there was no significant group difference (TD > ASD or ASD > TD) when we examined functional connectivity using the left insula or the left pSTS as a seed region. The peak coordinates, level of significance, regional extent, and anatomical labels for the regions of differential functional connectivity are provided, by anatomical seed (right insula and right pSTS), in Table 4.
Figure 4.

Functional connectivity analyses of TD > ASD on (Arm > Palm). We used anatomically defined right insular cortex (top, outlined in blue) and right pSTS (bottom, outlined in yellow) as seeds. Top: in TD relative to ASD, greater functional connectivity was identified between (A) the right insula and ventromedial prefrontal cortex (vmPFC), and (B) the right insula and the paracentral lobule. Bottom: in TD relative to ASD, greater functional connectivity was identified between (A) the right pSTS and the right amygdala extending into the hippocampus and (B) the right pSTS and the anterior temporal lobe, extending into the FG. Age was controlled for as a covariate of no interest. The results were estimated using FSL's mixed-effects algorithm (FLAME1 + 2) and corrected for multiple comparisons at a voxel-level threshold Z > 1.96, cluster-level threshold P < 0.05.
Table 4.
Functional connectivity results—TD > ASD
| Cluster | # of voxels | Local maxima |
||||
|---|---|---|---|---|---|---|
| Approx. region | x | y | z | Z-score | ||
| Seed: right insular cortex | ||||||
| 1 | 618 | R precentral gyrus | 4 | −26 | 62 | 3.31 |
| L precentral gyrus | −12 | −22 | 64 | 3.23 | ||
| R postcentral gyrus | 12 | −34 | 64 | 2.81 | ||
| 2 | 590 | L subcallosal cortex | −8 | 20 | −18 | 3.36 |
| L frontal medial cortex | −4 | 34 | −22 | 2.98 | ||
| R subcallosal cortex | 6 | 20 | −14 | 2.96 | ||
| Seed: right posterior superior temporal sulcus | ||||||
| 1 | 724 | R inferior temporal gyrus | 46 | −18 | −22 | 3.44 |
| R middle temporal gyrus | 56 | −2 | −26 | 3.03 | ||
| R amygdala | 30 | −8 | −14 | 3.13 | ||
| R pallidum | 16 | −4 | −10 | 2.90 | ||
The coordinates are in the MNI152 space, mm.
Finally, we examined the relationship between Arm versus Palm brain responses and the Autism Diagnostic Observation Schedule (ADOS) Calibrated Severity score (CSS). As illustrated in Figure 5A, we found that autism symptom severity negatively correlated with the Arm > Palm brain reactivity in the left precentral and postcentral gyri. Because this region was involved in processing Arm versus Palm touch in the TD (vs. ASD) group (see Figure 1 and Supplementary Fig. S1B), this finding suggests that reduced processing of CT-targeted (vs. non-CT-targeted) touch in ASD is correlated with symptom severity. Furthermore, as illustrated in Figure 5B, when we combined gentle touch to the arm and palm (Arm + Palm) in our analyses, we found that the touch was generally negatively correlated with ADOS CSS scores in the mPFC, suggesting that altered processing of gentle touch, regardless of the touch location, is associated with symptom severity within ASD.
Figure 5.

Results of a whole-brain correlation analysis between ADOS Calibrated Severity Scores (CSS) and Arm versus Palm activities. (A) Greater levels of autism symptom severity were associated with decreased reactivity to (Arm > Palm) in the left precentral gyrus and the left postcentral gyrus (orange-to-yellow color map). (B) Greater levels of autism symptom severity were associated with decreased reactivity to (Arm + Palm) in brain regions including primarily the medial prefrontal cortex (green-to-light green color map). Age was controlled for as a covariate of no interest. The results were estimated using FSL's mixed-effects algorithm (FLAME1 + 2) and corrected for multiple comparisons at a voxel-level threshold Z > 1.96, cluster-level threshold P < 0.05. **P < 0.01.
Discussion
Children and adolescents with ASD-lacked activation in response to CT-targeted touch in a network of brain regions known to be involved in social–emotional information processing including bilateral insula and insular operculum, right pSTS, bilateral TPJ extending into the IPL, right FG, right amygdala, and vlPFC (prominently including the precentral and inferior frontal gyri). Prior work has identified dysfunction in these and other brain regions involved in social–emotional information processing in response to visual (e.g., Dapretto et al. 2006; Kaiser et al. 2010) and auditory (e.g., Abrams et al. 2013) stimuli in individuals with ASD (for a review, see Yang et al. 2015). Here we identified disrupted brain mechanisms for processing CT-targeted affective touch—supporting the conclusion that there exists a fundamental deficit in social–emotional information processing in ASD shared across at least 3 (touch, sight, and sound) sensory modalities. Reduced reactivity of the social–emotional information-processing network in children and adolescents with ASD is consistent with the dampened response to positive and neutral touch reported in a recent fMRI study of adults with ASD by Cascio et al. (2012).
Whereas decreased activation of this network in the children and adolescents with ASD might represent disruption in processing the social aspects of touch, the recruitment of an extended network of brain regions involved in social–emotional processing in response to touch in TD children and adolescents may reflect an innate understanding of the social and emotional significance of touch. Consistent with this interpretation, TD children and adolescents exhibited significantly greater functional connectivity from the right insula to the right vmPFC and from the right pSTS to the right amygdala and right anterior temporal lobe than individuals with ASD in response to CT-targeted affective touch. In addition, exploratory correlational analyses revealed that among individuals with ASD, the Arm > Palm response in the left precentral and postcentral gyri correlated negatively with the autism symptom severity.
In the Palm > Arm contrast, individuals with ASD (vs. TD) exhibited an enhanced response in primary somatosensory cortex and the insula, suggesting atypical sensory hyper-reactivity to non-CT-targeted (vs. CT-targeted) touch. This is in line with the intense world hypothesis (Markram and Markram 2010), which posits that the deficits in ASD, such as sensory processing hypersensitivity, stem from hyperfunctioning of local neural circuits and may be characterized by hyper-reactivity in localized regions of neocortex. Together, our results suggest that people with ASD are cortically hyper-reactive to non-CT-targeted touch, while being hyporeactive to CT-targeted touch.
A major limitation of the current study was an imbalance between males and females in the ASD and TD groups. Although our findings are largely consistent whether controlling for gender or not, future work must match the gender across the 2 groups and directly investigate the important issue of sex differences in both the TD and ASD populations. Historically, girls with ASD were excluded from studies or included at such low rates that it has been impossible to draw meaningful conclusions. This has led to profound health disparities for girls with ASD including delays in diagnosis and treatment and blocked access to care. We desperately need to study how girls respond to treatments if we are going to develop better treatments for girls (and boys) with ASD. A second limitation rests in our observation of a trend of a behavioral difference such that ASD participants rate touch as more pleasant than the TD. While not a statistically significant difference, this trend is consistent with results reported by Cascio et al. (2008). Our relatively small sample size did not allow us to gain a full understanding of this trend. Future work will need to recruit a much larger sample to better explore this and other potentially interesting differences.
The study of atypical brain responses exhibited by children and adolescents with ASD in response to gentle touch targeting CT-nerve fibers is of particular interest from a clinical perspective. These nerve fibers are thought to represent an evolutionarily conserved mechanism for processing caress-like touch (Morrison et al. 2010), a kind of touch that serves a critical role in the development of the social brain and social interactions across the lifespan (Thayer 1986; Stack 2001; Barnett 2005; Fairhurst et al. 2014). The IPL is involved in processing information from the visual, auditory and somatosensory association cortices, and is categorized as a heteromodal association cortex (Mesulam 1985) with connections to other heteromodal association cortex regions, the limbic system, and the hypothalamus. Activation in this limbic-connected region may support the evolutionary importance of CT-targeted touch (Morrison et al. 2010), signaling limbic regions to categorize such touch as affectively important and socially salient in TD children and adolescents. Anterior insula responses to CT-targeted versus non-CT-targeted touch are consistent with this type of touch signaling greater affective salience (Uddin and Menon 2009).
The finding that TD children and adolescents show a greater response in this region to CT-targeted versus non-CT-targeted touch, while children and adolescents with ASD do not, is concordant with previous work illustrating this region's typical role in processing the affective components of tactile input. The atypical response pattern of the children and adolescents with ASD signifies a disruption in processing gentle touch targeting CT nerves at the neural systems level and potentially contributes to a derailment of social brain development given the importance of touch in early development (Thayer 1986; Stack 2001; McGlone et al. 2014). Because the touch system is well developed at (and before) birth (Kisilevsky et al. 1998), our results might provide a very early indicator of brain dysfunction in ASD, which could serve as a target for measuring improvement in future intervention studies.
Supplementary Material
Supplementary Material can be found at http://www.cercor.oxfordjournals.org/ online.
Funding
This work was supported by the Harris Professorship to K.A.P., a grant from Autism Speaks to M.D.K. and K.A.P., and an Autism Speaks Meixner Postdoctoral Fellowship in Translational Research (#9284) to D.Y.J.Y. In addition, this work was supported in part by the Yale University Biomedical High-Performance Computing Center (NIH grants RR19895 and RR029676-01).
Supplementary Material
Notes
We express our gratitude to the children, adolescents, and their families who participated in this research. Conflicts of Interest: None declared.
References
- Abrams DA, Lynch CJ, Cheng CM, Phillips J, Supekar K, Ryali S, Uddin LQ, Menon V. 2013. Underconnectivity between voice-selective cortex and reward circuitry in children with autism. Proc Natl Acad Sci USA. 110:12061–12065. [DOI] [PMC free article] [PubMed] [Google Scholar]
- American Psychiatric Association. 2013. Diagnostic and Statistical Manual of Mental Disorders. 5th ed Arlington: (VA: ): American Psychiatric Publishing. [Google Scholar]
- American Academy of Pediatrics. 2012. Sensory integration therapies for children with developmental and behavioral disorders. Pediatrics. 129:1186–1189. [DOI] [PubMed] [Google Scholar]
- Baranek GT. 1999. Autism during infancy: a retrospective video analysis of sensory-motor and social behaviors at 9–12 months of age. J Autism Dev Disord. 29:213–224. [DOI] [PubMed] [Google Scholar]
- Barnett L. 2005. Keep in touch: the importance of touch in infant development. Infant Obs. 8:115–123. [Google Scholar]
- Bennett RH, Bolling DZ, Anderson LC, Pelphrey KA, Kaiser MD. 2014. fNIRS detects temporal lobe response to affective touch. Soc Cogn Affect Neurosci. 94:470–476. [DOI] [PMC free article] [PubMed] [Google Scholar]
- Bradley MM, Lang PJ. 1994. Measuring emotion: the self-assessment manikin and the semantic differential. J Behav Ther Exp Psychiatry. 25:49–59. [DOI] [PubMed] [Google Scholar]
- Brothers L. 1990. The social brain: a project for integrating primate behavior and neurophysiology in a new domain. Concept Neurosci. 1:27–51. [Google Scholar]
- Cascio C, McGlone F, Folger S, Tannan V, Baranek G, Pelphrey KA, Essick G. 2008. Tactile perception in adults with autism: a multidimensional psychophysical study. J Autism Dev Disord. 38:127–137. [DOI] [PMC free article] [PubMed] [Google Scholar]
- Cascio CJ, Moana-Filho EJ, Guest S, Nebel MB, Weisner J, Baranek GT, Essick GK. 2012. Perceptual and neural response to affective tactile texture stimulation in adults with autism spectrum disorders. Autism Res. 5:231–244. [DOI] [PMC free article] [PubMed] [Google Scholar]
- Cascio CJ, Lorenzi J, Baranek GT. 2013. Self-reported pleasantness ratings and examiner-coded defensiveness in response to touch in children with ASD: effects of stimulus material and bodily location. J Autism Dev Disord. 5:1–10. [DOI] [PMC free article] [PubMed] [Google Scholar]
- Dapretto M, Davies MS, Pfeifer JH, Scott AA, Sigman M, Bookheimer SY, Iacoboni M. 2006. Understanding emotions in others: mirror neuron dysfunction in children with autism spectrum disorders. Nat Neurosci. 9:28–30. [DOI] [PMC free article] [PubMed] [Google Scholar]
- Elliott CD. 1990. Differential ability scales. New York: (NY: ): The Psychological Corporation. [Google Scholar]
- Essick G, James A, McGlone FP. 1999. Psychophysical assessment of the affective components of non-painful touch. Neuroreport. 10:2083–2087. [DOI] [PubMed] [Google Scholar]
- Fairhurst MT, Löken L, Grossmann T. 2014. Physiological and behavioral responses reveal 9-month-old infants’ sensitivity to pleasant touch. Psychol Sci. 25:1124–1131. [DOI] [PMC free article] [PubMed] [Google Scholar]
- Field T, Lasko D, Mundy P, Henteleff T, Kabat S, Talpins S, Dowling M. 1997. Brief report: autistic children's attentiveness and responsivity improve after touch therapy. J Autism Dev Disord. 27:333–338. [DOI] [PubMed] [Google Scholar]
- Gordon I, Voos AC, Bennett RH, Bolling DZ, Pelphrey KA, Kaiser MD. 2013. Brain mechanisms for processing affective touch. Hum Brain Mapp. 34:914–922. [DOI] [PMC free article] [PubMed] [Google Scholar]
- Grandin T. 1989. An autistic person's view of holding therapy. Communication (Published by National Autistic Society of England). 23:75–76. [Google Scholar]
- Jenkinson M, Beckmann CF, Behrens TE, Woolrich MW, Smith SM. 2012. FSL. Neuroimage. 62:782–790. [DOI] [PubMed] [Google Scholar]
- Kaiser MD, Hudac CM, Shultz S, Lee S, Cheung C, Berken AM, Deen B, Pitskel NB, Sugrue DR, Voos AC et al. 2010. Neural signatures of autism. Proc Natl Acad Sci USA. 107:21223–21228. [DOI] [PMC free article] [PubMed] [Google Scholar]
- Kern JK, Trivedi MH, Grannermann BD, Garver CR, Johnson DG, Andrews AA. 2007. Sensory correlations in autism. Autism. 11:123–134. [DOI] [PubMed] [Google Scholar]
- Kisilevsky BS, Fearon I, Muir DW. 1998. Fetuses differentiate vibracoustic stimuli. Infant Behav Dev. 21:25–46. [Google Scholar]
- Kumazawa T, Perl ER. 1977. Primate cutaneous sensory units with unmyelinated C afferent fibers. J Neurophysiol. 40:1325–1338. [DOI] [PubMed] [Google Scholar]
- Löken L, Wessberg J, Morrison I, McGlone F, Olausson H. 2009. Coding of pleasant touch by unmyelinated afferents in humans. Nat Neurosci. 12:547–548. [DOI] [PubMed] [Google Scholar]
- Lord C, Risi S, Lambrecht L, Cook EH, Leventhal BL, DiLavore PC, Pickles A, Rutter M. 2000. The Autism diagnostic observation schedule-generic: a standard measure of social and communication deficits associated with the spectrum of autism. J Autism Dev Disord. 30:205–223. [PubMed] [Google Scholar]
- Lord C, Rutter M, Le Couteur A. 1994. Autism Diagnostic Interview-Revised: a revised version of a diagnostic interview for caregivers of individuals with possible pervasive developmental disorders. J Autism Dev Disord. 24:659–685. [DOI] [PubMed] [Google Scholar]
- Markram K, Markram H. 2010. The intense world theory: a unifying theory of the neurobiology of autism. Front Hum Neurosci. 4:224. [DOI] [PMC free article] [PubMed] [Google Scholar]
- Mesulam MM, editor. 1985. Patterns in behavioral neuroanatomy: association areas, the limbic system, and hemispheric specialization. Principles behavioral neurology. Philadelphia: (PA: ): Springer; p. 1–58. [Google Scholar]
- McGlone F, Vallbo AB, Olausson H, Löken L, Wessberg J. 2007. Discriminative touch and emotional touch. Can J Exp Psychol. 61:173–183. [DOI] [PubMed] [Google Scholar]
- McGlone F, Wessberg J, Olausson H. 2014. Discriminative and affective touch: sensing and feeling. Neuron. 82:737–755. [DOI] [PubMed] [Google Scholar]
- McLaren DG, Ries ML, Xu G, Johnson SC. 2012. A generalized form of context-dependent psychophysiological interactions (gPPI): a comparison to standard approaches. Neuroimage. 61:1277–1286. [DOI] [PMC free article] [PubMed] [Google Scholar]
- Morrison I, Loken LS, Olausson H. 2010. The skin as a social organ. Exp Brain Res. 204:205–314. [DOI] [PubMed] [Google Scholar]
- Olausson H, Lamarre Y, Backlund H, Morin C, Wallin BG, Starck G, Ekholm S, Strigo I, Worsley K, Vallbo AB et al. 2002. Unmyelinated tactile afferents signal touch and project to insular cortex. Nat Neurosci. 5:900–904. [DOI] [PubMed] [Google Scholar]
- Penfield W, Rasmussen T. 1950. The cerebral cortex of man: a clinical study of localization of function. New York: Macmillan. [Google Scholar]
- Salimi-Khorshidi G, Douaud G, Beckmann CF, Glasser MF, Griffanti L, Smith SM. 2014. Automatic denoising of functional MRI data: combining independent component analysis and hierarchical fusion of classifiers. Neuroimage. 90:449–68. [DOI] [PMC free article] [PubMed] [Google Scholar]
- Stack DM. 2001. The salience of touch and physical contact during infancy: unraveling some of the mysteries of the somesthetic sense. In: Bremner A, Fogel A, editors. Blackwell handbook of infant development. Oxford: (UK: ): Blackwell Publishing Ltd; p. 351–378. [Google Scholar]
- Thayer S. 1986. History and strategies of research on social touch. J Nonverbal Behav. 10:12–28. [Google Scholar]
- Uddin LQ, Menon V. 2009. The anterior insula in autism: under-connected and under-examined. Neurosci Biobehav Rev. 33:1198–1203. [DOI] [PMC free article] [PubMed] [Google Scholar]
- Vallbo A, Olausson H, Wessberg J, Norrsell U. 1993. A system of unmyelinated afferents for innocuous mechanoreception in the human skin. Brain Res. 628:301–304. [DOI] [PubMed] [Google Scholar]
- Voos A, Pelphrey KA, Kaiser MD. 2012. Autistic traits are associated with diminished neural response to affective touch. Soc Cogn Affect Neurosci. 8:378–386. [DOI] [PMC free article] [PubMed] [Google Scholar]
- Yang DYJ, Rosenblau G, Keifer C, Pelphrey KA. 2015. An integrative neural model of social perception, action observation, and theory of mind. Neurosci Biobehav Rev. 51:263–275. [DOI] [PMC free article] [PubMed] [Google Scholar]
Associated Data
This section collects any data citations, data availability statements, or supplementary materials included in this article.