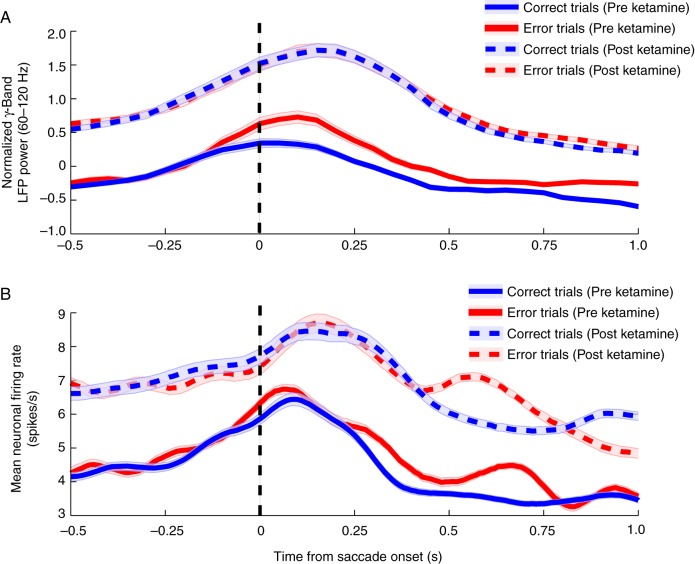
Figure 5.
Gamma-band LFP power and corresponding neuronal firing rates. (A) Mean high-gamma-band (60–120 Hz) activity ± SEM is plotted contrasting both preketamine (solid lines) correct trials (blue) and error trials (red) with postketamine (dashed lines) values. The pattern of activity is notably similar to the mean spiking activity simultaneously measured from neurons in the PFC (B) in both their peak activity epoch and their response to ketamine administration.

