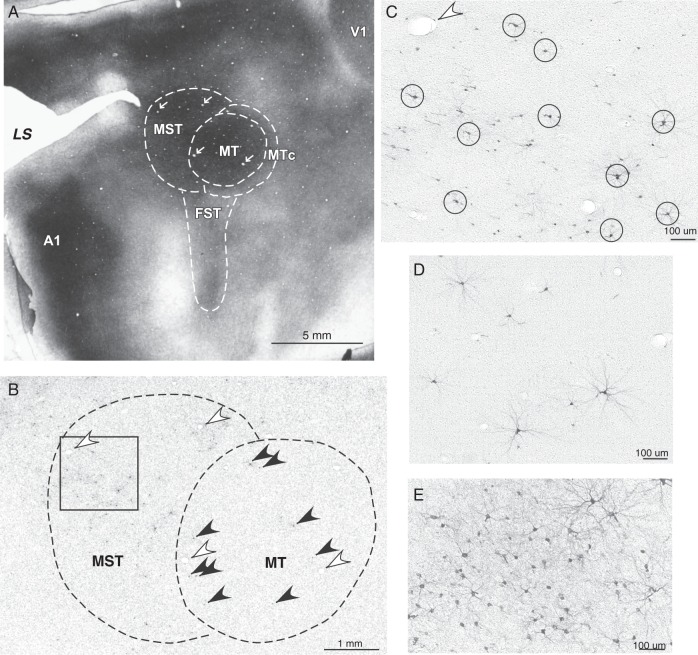
Figure 2.
Photomicrographs of brain sections cut parallel to the surface of flattened cortex in the middle temporal region in case 04-39. (A) Section stained for myelinated fibers with dark MT and MST, and lighter FST. The proposed boundaries of these areas and MTc are indicated. Primary auditory cortex (A1) and visual cortex (V1) are also densely myelinated. (B) Section through MT and MST processed for BDA with inset magnified in C. Note single BDA-labeled neurons (black arrows) in MT. C shows neurons labeled in MST; some of the largest and darkly labeled neurons are circled. White arrows in A, B mark corresponding blood vessels. D, E show sparse and dense distributions of labeled neurons in MST and dorsal V2, respectively.

