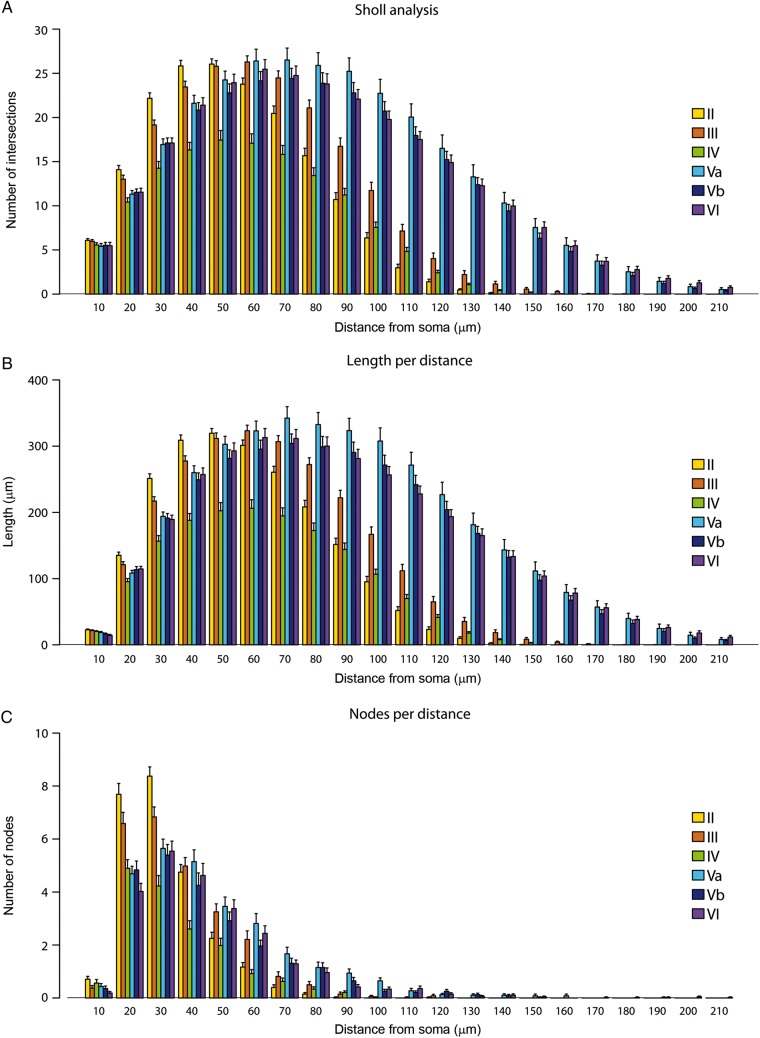
Figure 5.
Graphs showing the variables analyzed, per distance from soma, in each cortical layer sampled from the S1HL region of P14 rats. Measurements are reported as mean ± SEM. Statistical significance of the differences is shown in Table 1. Mean values of each of the variables analyzed are shown in Supplementary Tables 2 and 3.

