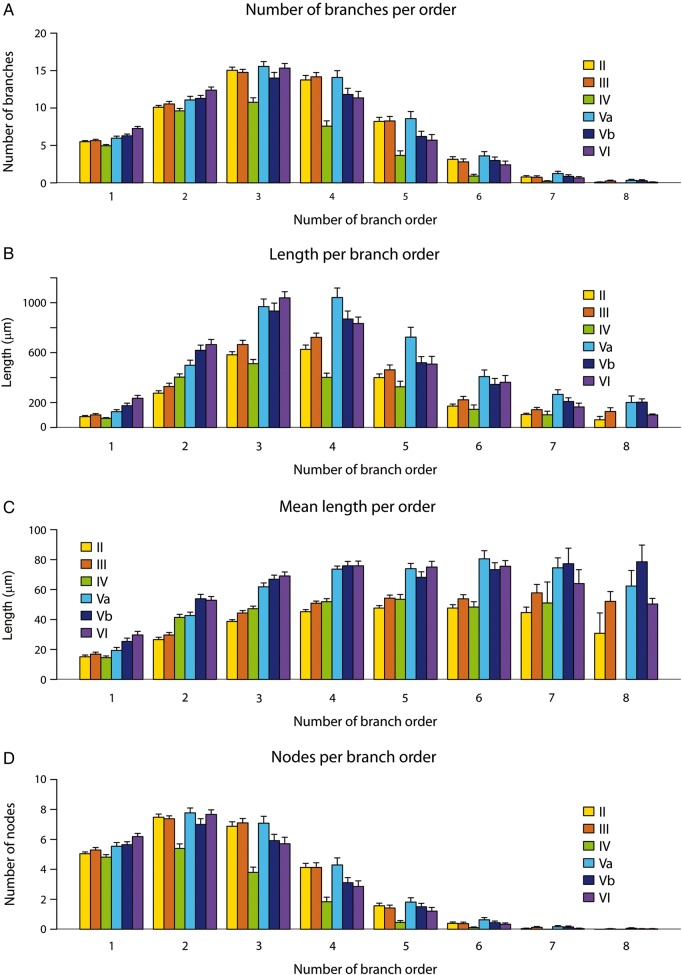
Figure 6.
Graphs showing representative variables analyzed, per branch order, in each cortical layer sampled from the S1HL region of P14 rats. Measurements are reported as mean ± SEM. Statistical significance of the differences is shown in Table 1. Mean values of each of the variables analyzed are shown in Supplementary Table 4.

