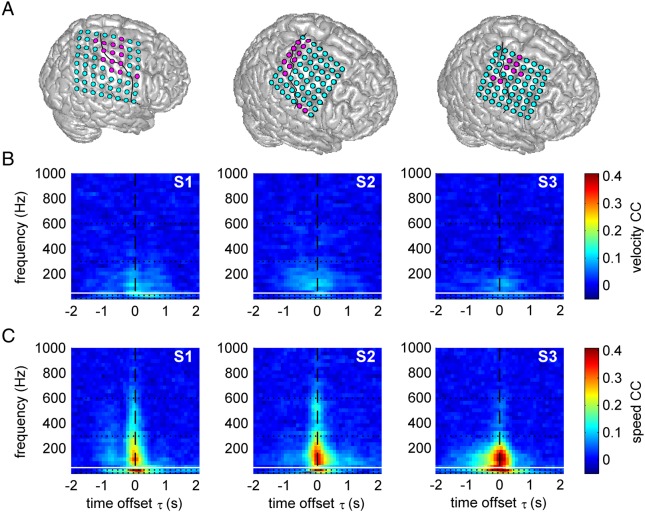
Figure 4.
Time–frequency resolved decoding of velocity and speed from ECoG power modulations. (A) Position of ECoG grids in S1–S3. Magenta: electrodes with hand-arm motor response upon ESM used for decoding; solid black line: central sulcus. Results for movement velocity (B) and speed (C), both from the 1-D task. Values refer to the mean CC over all test sets. The horizontal white line at 50 Hz indicates the frequency position of line noise. Speed was better decodable than velocity, up to very high frequencies (>600 Hz).

