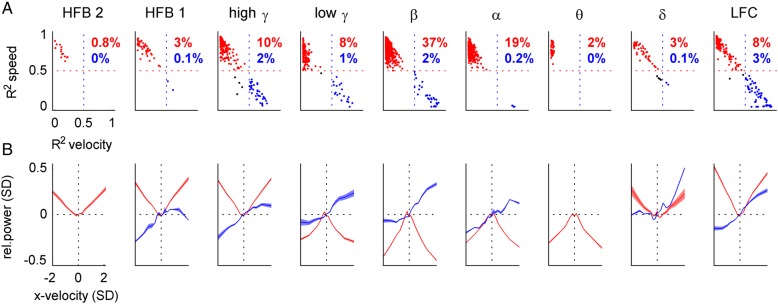
Figure 8.
Velocity and speed tuning profiles of iEEG features. We investigated velocity tuning functions of the iEEG features (columns, indicated by title) from all recorded channels, sampled in steps of 100 ms at different time offsets τ with respect to movement execution. (A) Scatter plots of R2 values of the correlation of iEEG features with the “perfect” velocity-type (x-axis) and speed-type (y-axis) tuning profiles. If the speed or velocity R2 was >0.5, an instance was classified as speed-type (red) or velocity-type (blue), respectively (percentages of these instances in red and blue). For example, in the β band, 37% of all (n = 348) significantly tuned channels at different time offsets were classified as speed-type. (B) Velocity tuning profiles (mean ± SEM) of iEEG features classified as speed-type (red) or velocity-type (blue). The power modulation was taken relative to that of zero velocity (dotted horizontal black line). Movement velocity was normalized to unit SD, direction of movement is indicated by the sign of velocity (positive = right, negative = left). The power in the higher frequency bands (>50 Hz) closely resembled the “perfect” speed tuning, linearly increasing with magnitude of velocity, irrespective of its direction.

