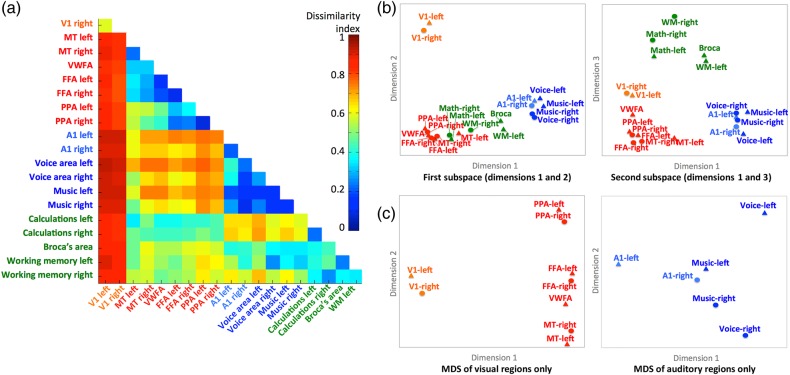
Figure 4.
Second-order RSA of functional areas. (a) Matrix of all pairwise dissimilarities between the representational geometries in searchlight ROIs. (b) Multidimensional scaling (MDS) plots of the relationships among the representational geometries in visual (orange and red), auditory (blue), and cognitive (green) ROIs. Searchlight ROIs are the same as those shown in Figures 2 and 3. The plot on the left shows the ROIs plotted on the first and second dimensions. The plot on the right shows the ROIs plotted on the first and third dimensions. (c) Separate MDS analyses restricted to the visual (left) and auditory areas (right).

