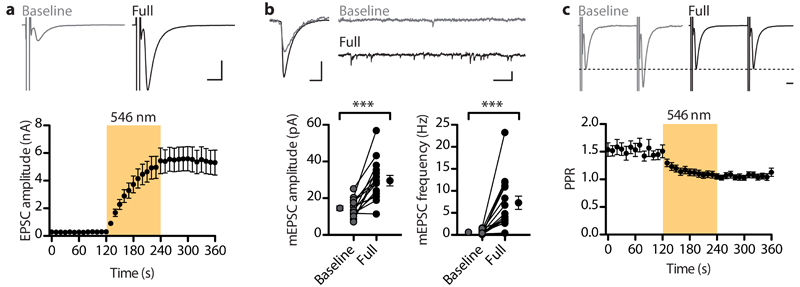
Fig. 4. Neurons with residual glutamate release after Baf-treatment have smaller mEPSCs and a high paired-pulse ratio.
(a) Residual EPSC of a neuron incubated for 165 min in Baf (baseline, gray trace), which increased to 400% after pHoenix activation (full, black trace). Scale bars, 5 ms, 0.5 nA. EPSC recovery shown for 20 cells with residual release (0.3 ± 0.1 nA before, 5.5 ± 0.9 nA after illumination, τ = 66 s; N = 7). (b) Average mEPSCs and example trace of mEPSCs recorded from a neuron before (gray) and after (black) activation of pHoenix. Scale bars, left: 5 ms and 10 pA; right: 100 ms and 50 pA. mEPSC amplitudes increased from 17 ± 2 to 29 ± 3 pA, and mEPSC frequency increased from 0.7 ± 0.2 to 8.1 ± 1.7 Hz (n = 15, N = 7, amplitudes: P < 0.0001, paired two-tailed t-test, t14 = 5.847; frequency: P < 0.0001, Wilcoxon signed-rank test, W = –120). (c) Paired EPSCs evoked at 40 ms interval during baseline and after pHoenix activation. Amplitudes scaled to first EPSC. Scale bar, 5 ms. Time course of the paired-pulse ratio change from the same cells as in (a). PPR decreased from 1.5 ± 0.1 to 1.1 ± 0.1, with τ = 23 s.

