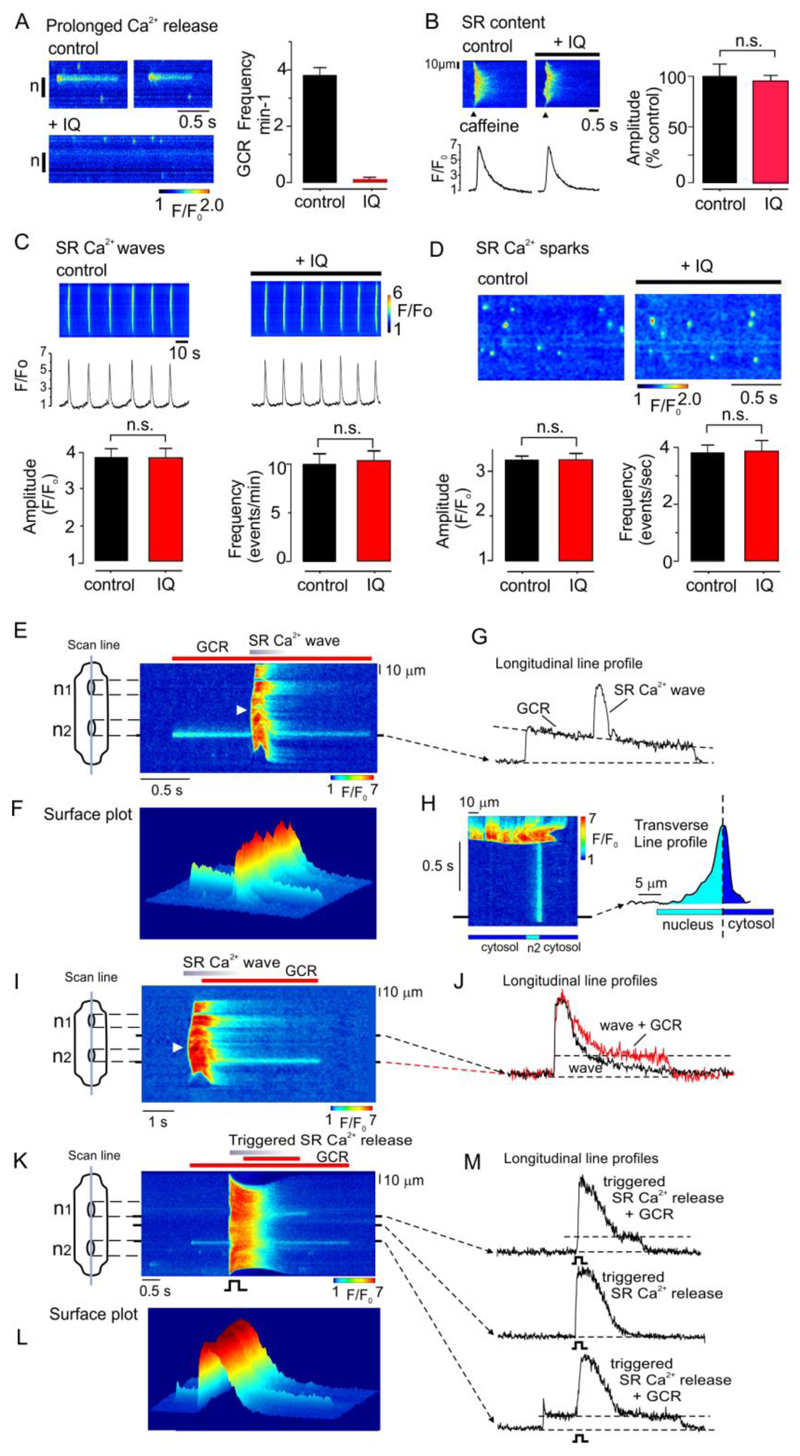
Fig. 2. IQ inhibits Golgi Ca2+ release but not SR Ca2+-release.
(A) Line scan (left) and mean data (right) showing that in cells initially exhibiting repetitive Golgi Ca2+ release, a subsequent 15 minute exposure to IQ (laser off) abolished Golgi Ca2+ release (n=26 cells from 3 hearts). (B) original line scan (left) and mean data (right) showing that IQ had no significant effect on the SR Ca2+ content assessed as assessed by rapid application caffeine (n=6 cells from 3 hearts) (C) Original line scan (upper) and mean data (lower) showing that IQ has no significant effect on spontaneous SR Ca2+ wave amplitude or frequency.(n=8 cells from 3 hearts) (D) Original line scan (upper) and mean data (lower) showing absence of effect of IQ had on the frequency or amplitude of spontaneous Ca2+ sparks (n=8 cells from 3 hearts). * p<0.05. n.s., not significant. (E) A line scan image (upper left) and corresponding surface plots (lower left & right) obtained from a permeabilized ARVM in which a spontaneous SR Ca2+ wave occurred during a prolonged Ca2+-release event. The line profile is positioned through the prolonged Ca2+-release event (upper right). A surface plot orientated from the direction of the arrow (lower right) and the accompanying line profile (right) indicates diffusion of Ca2+ . (F) A line scan image showing an SR Ca2+ wave originating near the center of a permeabilized cell (arrow) triggered a prolonged Ca2+-release event from the upper pole of n2 (left) and associated line profiles (right). (G) A line scan image from an intact myocyte showing a global SR Ca2+-release induced by field stimulation, during a prolonged Ca2+-release event originating from one end of n2. In E-G, similar results were obtained in cells from 2-3 hearts.

