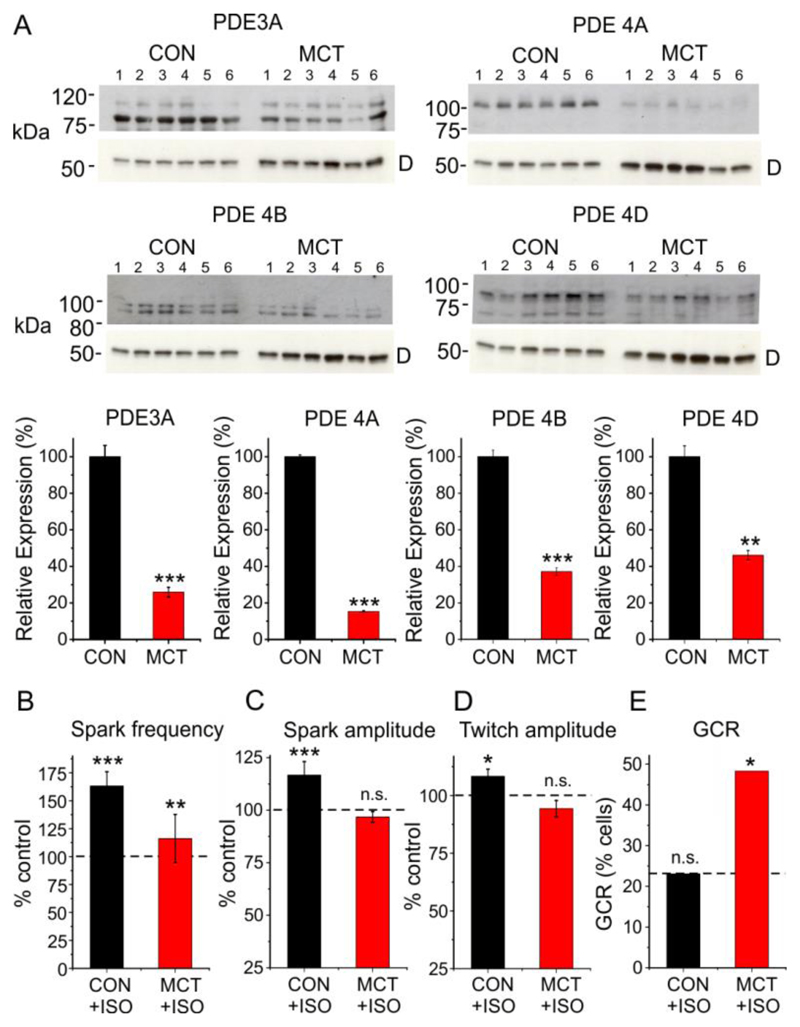
Fig. 4. Changes in PDE expression and Ca2+ regulation in heart failure.
(A) Western blot data obtained from the hearts of 6 control and 6 MCT-induced heart failure animals (upper) and corresponding mean data (lower) showing PDE 3A, 4A, 4B and 4D expression. ‘D’ indicates band corresponding to desmin at ~ 50 kDa. The data were normalized to desmin expression. (B) Mean data showing changes in spark frequency, spark amplitude, twitch amplitude and the percentage of cells exhibiting Golgi Ca2+ release following exposure to 20 nM ISO in control. For each condition, data were obtained from 22-29 cells from 5 control and 6 MCT hearts. *p<0.05, ** p<0.01, ***, p<0.005.

