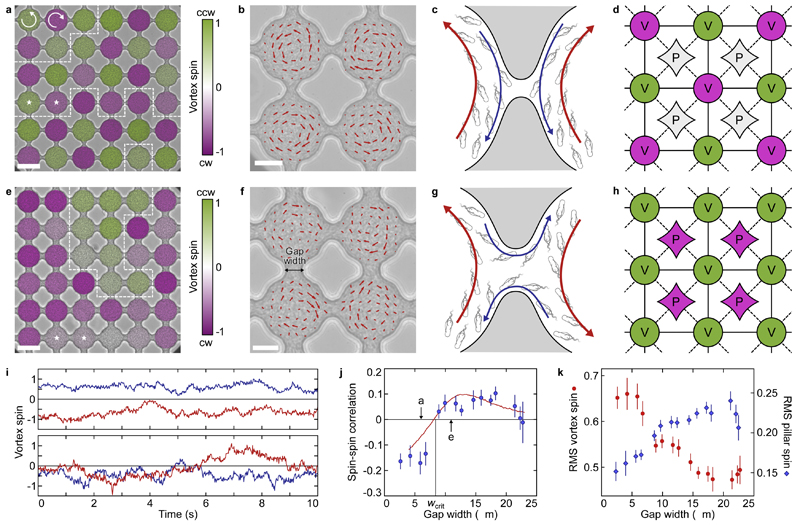
Figure 1. Edge currents determine antiferromagnetic and ferromagnetic order in a square lattice of bacterial vortices.
a, Three domains of antiferromagnetic order highlighted by dashed white lines (gap width w = 6 μm). Scale bar: 50 μm. Overlaid false colour shows spin magnitude (see Supplementary Video 1 for raw data). b, Bacterial flow PIV field within an antiferromagnetic domain (Supplementary Video 1). For clarity, not all velocity vectors are shown. Largest arrows correspond to speed 40 μm/s. Scale bar: 20 μm. c, Schematic of bacterial flow circulation in the vicinity of a gap. For small gaps w < wcrit, bacteria forming the edge currents (blue arrows) swim across the gap, remaining in their original cavity. Bulk flow (red) is directed opposite to the edge current15,16 (Supplementary Video 3). d, Graph of the Union Jack double-lattice model in an antiferromagnetic state with zero net pillar circulation. Solid and dashed lines depict vortex–vortex and vortex–pillar interactions of respective strengths Jv and Jp. Vortices and pillars are colour-coded according to their spin. e, For supercritical gap widths w > wcrit, extended domains of ferromagnetic order predominate (Supplementary Video 2; w = 11 μm). Scale bar: 50 μm. f, PIV field within a ferromagnetic domain (Supplementary Video 2). Largest arrows: 36 μm/s. Scale bar: 20 μm. g, For w > wcrit, bacteria forming the edge current (blue arrows) swim along the PDMS boundary through the gap, driving bulk flows (red) in the opposite directions, thereby aligning neighbouring vortex spins. h, Ferromagnetic state of the Union Jack lattice induced by edge current loops around the pillars. i, Trajectories of neighbouring spins (*-symbols in a,e) fluctuate over time, signalling exploration of an equilibrium under a non-zero effective temperature (top: antiferromagnetic; bottom: ferromagnetic). j, The zero of the spin–spin correlation χ at wcrit ≈ 8 μm marks the phase transition. The best-fit Union Jack model (solid line) is consistent with the experimental data. k, RMS vortex spin decreases with the gap size w, showing weakening of the circulation. RMS pillar spin increases with w, reflecting enhanced bacterial circulation around pillars. Each point in j,k represents an average over ≥ 5 movies in 3 μm bins at 1.5 μm intervals; vertical bars indicate standard errors (Methods).

