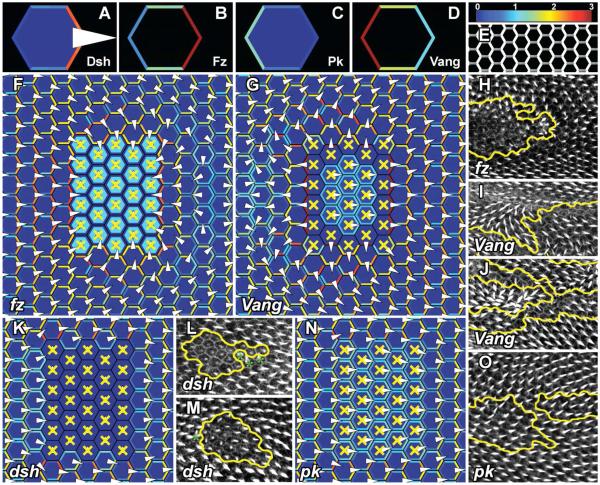
Figure 7.
Simulation results from the Amonlirdviman et al. model, reprinted from[71]. Wild-type results showing the final distributions of Dsh (A), Fz (B), Pk (C) and Vang (D). The same color scale is used in all figures, where 1 is scaled to the initial uniform concentration of Dsh and the scale is truncated so that concentrations greater than 3 are shown in red. (E) Simulated distribution of Dsh displayed as an intensity representing total Dsh concentrations, corresponding to the appearance of Dsh∷GFP in wild-type experiments. Simulation results of several PCP phenotypes showing the final distribution of Dsh with predicted hair growth directions derived from the vector sum of Dsh (F,G,K and N) and corresponding pupal wings (H-J,L,M and O). Greater Dsh asymmetry is represented by hair placement at increasing distances from the cell center. When Dsh asymmetry does not exceed the threshold value, the hair is depicted at the center of the cell. Mutant cells are designated with yellow. (H) fzR52 clones. (I and J) VangA3 clones. (L and M) dshV26 mutant clones. (O) pk-sple13 clones. Asterisks mark non-autonomous effects near dsh clones.

