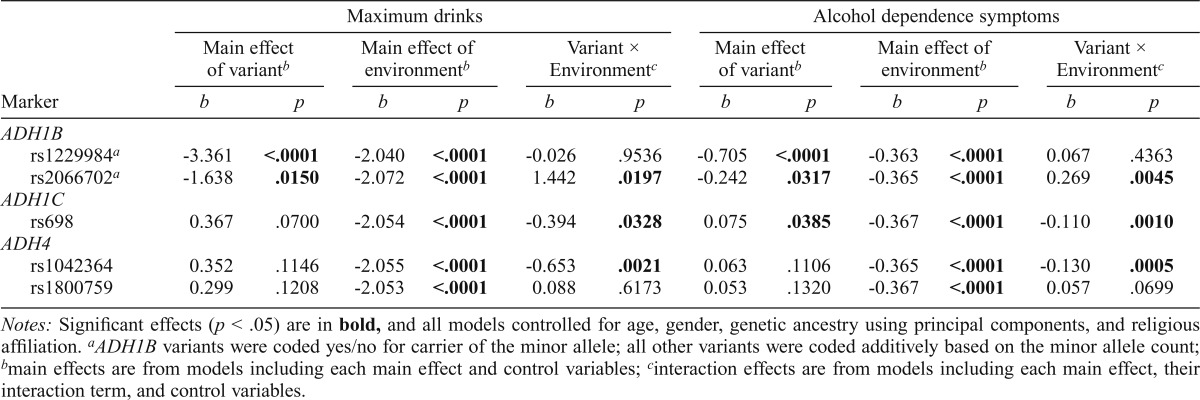
Table 3.
ADH gene variants, religious involvement, and associations with maximum drinks and dependence symptoms
| Marker | Maximum drinks |
Alcohol dependence symptoms |
||||||||||
| Main effect of variantb |
Main effect of environmentb |
Variant × Environmentc |
Main effect of variantb |
Main effect of environmentb |
Variant × Environment |
|||||||
| b | p | b | p | b | p | b | p | b | p | b | p | |
| ADH1B | ||||||||||||
| rs1229984a | -3.361 | <.0001 | -2.040 | <.0001 | -0.026 | .9536 | -0.705 | <.0001 | -0.363 | <.0001 | 0.067 | .4363 |
| rs2066702a | -1.638 | .0150 | -2.072 | <.0001 | 1.442 | .0197 | -0.242 | .0317 | -0.365 | <.0001 | 0.269 | .0045 |
| ADH1C | ||||||||||||
| rs698 | 0.367 | .0700 | -2.054 | <.0001 | -0.394 | .0328 | 0.075 | .0385 | -0.367 | <.0001 | -0.110 | .0010 |
| ADH4 | ||||||||||||
| rs1042364 | 0.352 | .1146 | -2.055 | <.0001 | -0.653 | .0021 | 0.063 | .1106 | -0.365 | <.0001 | -0.130 | .0005 |
| rs1800759 | 0.299 | .1208 | -2.053 | <.0001 | 0.088 | .6173 | 0.053 | .1320 | -0.367 | <.0001 | 0.057 | .0699 |
Notes: Significant effects (p < .05) are in bold, and all models controlled for age, gender, genetic ancestry using principal components, and religious affiliation.
ADH1B variants were coded yes/no for carrier of the minor allele; all other variants were coded additively based on the minor allele count;
main effects are from models including each main effect and control variables;
interaction effects are from models including each main effect, their interaction term, and control variables.

