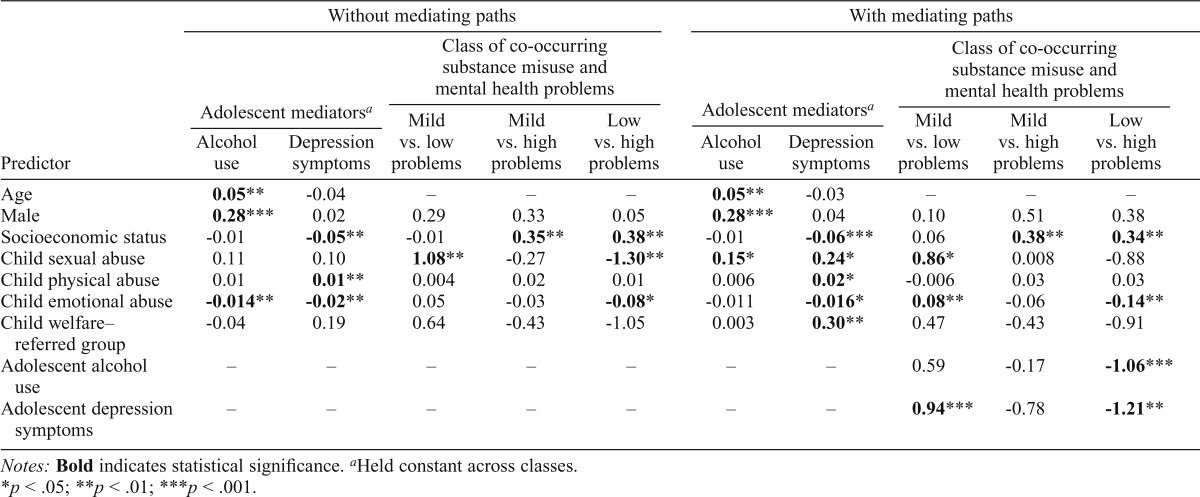
Table 4.
Path coefficients for effects of childhood maltreatment on adolescent mediators and adult classification based on latent class analysis without and with mediating paths
| Predictor | Without mediating paths |
With mediating paths |
||||||||
| Adolescent mediatorsa |
Class of co-occurring substance misuse and mental health problems |
Adolescent mediatorsa |
Class of co-occurring substance misuse and mental health problems |
|||||||
| Alcohol use | Depression symptoms | Mild vs. low problems | Mild vs. high problems | Low vs. high problems | Alcohol use | Depression symptoms | Mild vs. low problems | Mild vs. high problems | Low vs. high problems | |
| Age | 0.05** | -0.04 | – | – | – | 0.05** | -0.03 | – | – | – |
| Male | 0.28*** | 0.02 | 0.29 | 0.33 | 0.05 | 0.28*** | 0.04 | 0.10 | 0.51 | 0.38 |
| Socioeconomic status | -0.01 | -0.05** | -0.01 | 0.35** | 0.38** | -0.01 | -0.06*** | 0.06 | 0.38** | 0.34** |
| Child sexual abuse | 0.11 | 0.10 | 1.08** | -0.27 | -1.30** | 0.15* | 0.24* | 0.86* | 0.008 | -0.88 |
| Child physical abuse | 0.01 | 0.01** | 0.004 | 0.02 | 0.01 | 0.006 | 0.02* | -0.006 | 0.03 | 0.03 |
| Child emotional abuse | -0.014** | -0.02** | 0.05 | -0.03 | -0.08* | -0.011 | -0.016* | 0.08** | -0.06 | -0.14** |
| Child welfare–referred group | -0.04 | 0.19 | 0.64 | -0.43 | -1.05 | 0.003 | 0.30** | 0.47 | -0.43 | -0.91 |
| Adolescent alcohol use | – | – | – | – | – | – | – | 0.59 | -0.17 | -1.06*** |
| Adolescent depression symptoms | – | – | – | – | – | – | – | 0.94*** | -0.78 | -1.21** |
Notes: Bold indicates statistical significance.
Held constant across classes.
p < .05;
p < .01;
p < .001.

