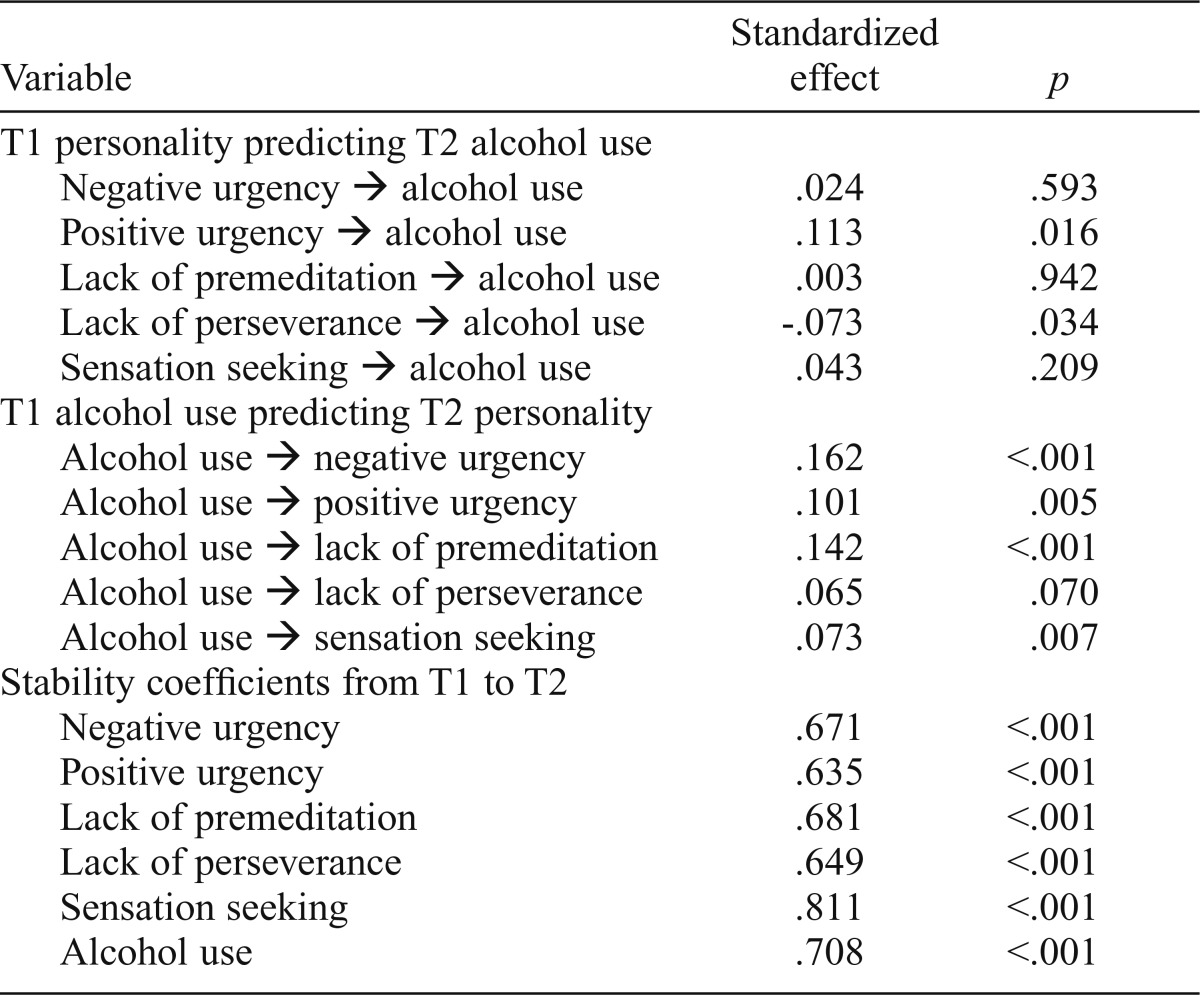
Table 2.
Standardized effects of Time 1 (T1) personality on Time 2 (T2) alcohol use and T1 alcohol use on T2 personality
| Variable | Standardized effect | p |
| T1 personality predicting T2 alcohol use | ||
| Negative urgency ➔ alcohol use | .024 | .593 |
| Positive urgency ➔ alcohol use | .113 | .016 |
| Lack of premeditation ➔ alcohol use | .003 | .942 |
| Lack of perseverance ➔ alcohol use | -.073 | .034 |
| Sensation seeking ➔ alcohol use | .043 | .209 |
| T1 alcohol use predicting T2 personality | ||
| Alcohol use ➔ negative urgency | .162 | <.001 |
| Alcohol use ➔ positive urgency | .101 | .005 |
| Alcohol use ➔ lack of premeditation | .142 | <.001 |
| Alcohol use ➔ lack of perseverance | .065 | .070 |
| Alcohol use ➔ sensation seeking | .073 | .007 |
| Stability coefficients from T1 to T2 | ||
| Negative urgency | .671 | <.001 |
| Positive urgency | .635 | <.001 |
| Lack of premeditation | .681 | <.001 |
| Lack of perseverance | .649 | <.001 |
| Sensation seeking | .811 | <.001 |
| Alcohol use | .708 | <.001 |

