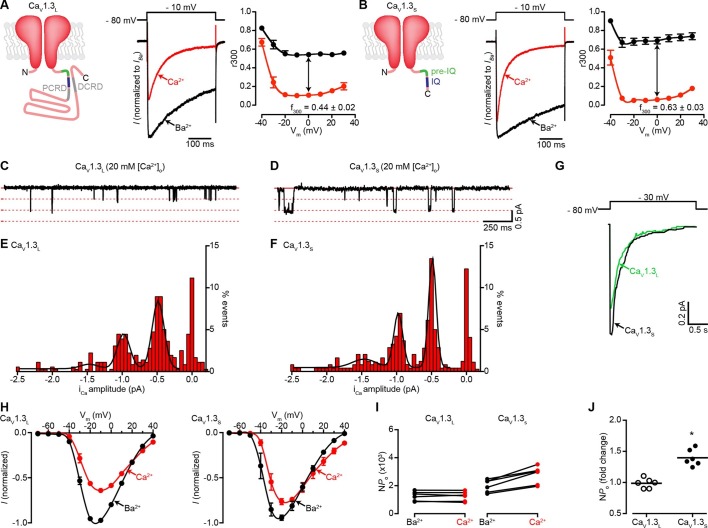
Figure 1. Ca2+ enhances the activity of CaV1.3S, but not CaV1.3L, channels.
(A) Left: Schematic of CaV1.3L channel splice variant, depicting the domains important for Ca2+-mediated regulation: pre-IQ (green), IQ (blue), proximal and distal C-terminal regulatory domains (PCRD, DCRD, gray). Middle: Representative ICa and IBa of CaV1.3L channels expressed in tsA-201 cells. Currents were evoked by a 300-ms depolarization from holding potential of -80 mV to a test potential of -10 mV, with 2 mM Ba2+ (black) or 2 mM Ca2+ (red) as the charge carrier in the same cell. Right: Voltage dependence of CaV1.3L channel CDI. r300 is the fraction of ICa or IBa remaining after 300 ms. f300 is the difference between ICa and IBa r300 values at 0 mV. (B) Left: Schematic of CaV1.3S channel splice variant. Middle: Representative ICa and IBa of CaV1.3S channels. Right: Voltage dependence of CaV1.3S channel CDI, format as in (A). ICa is presented as normalized to IBa, currents analyzed for these experiments were in a range between 200 and 900 pA. (C and D) Representative iCa single channel recordings from CaV1.3L (C) and CaV1.3S channels (D) expressed in tsA-201 cells during step depolarizations from -80 to -30 mV. (E and F) all-points iCa amplitude histograms for CaV1.3L (E) and CaV1.3S channels (F), the black line is the best fit to the data with a multi-Gaussian function with a quantal unit value of -0.48 ± 0.07 for CaV1.3L and -0.49 ± 0.01 pA for CaV1.3S channels, respectively (constructed from n = 6 cells each). Single channel recordings were also performed using Ba2+ as the charge carrier for both channels (see Figure 1—figure supplement 1). (G) Ensemble average single-channel currents from multiple sweeps. (H) Current-voltage relationships of CaV1.3L currents (left) and CaV1.3S currents (right) in the presence of 2 mM Ca2+ (red) or Ba2+ (black) as the charge carrier. Data were normalized to the maximum current in the presence of Ba2+. Symbols are averages of 7 cells ± SEM. (I) Scatter plots of NPo (at -10 mV) of CaV1.3L (left) and CaV1.3S (right) channels in the presence of Ba2+ and Ca2+. (J) Change in NPo for CaV1.3L and CaV1.3S channels for currents recorded in the presence of Ca2+ and then Ba2+. The horizontal bar shows the mean value (*p < 0.001).


