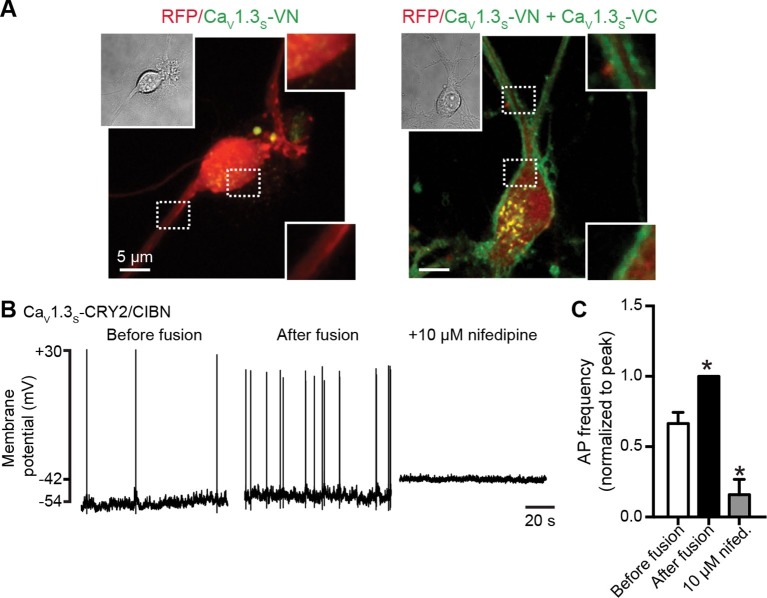
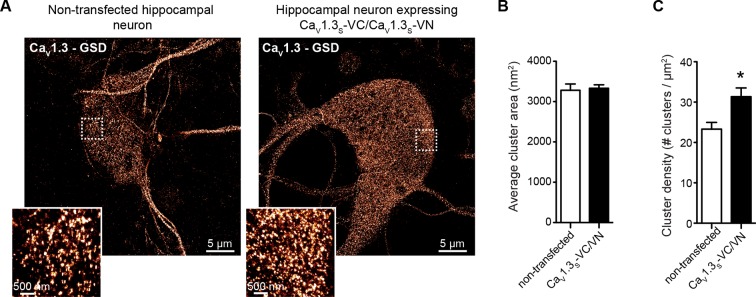
Figure 10. CaV1.3S coupling increases the firing rate of hippocampal neurons.
(A) Confocal images of two representative cultured hippocampal neurons expressing tRFP as a transfection marker (red) and CaV1.3S-VC (left, negative control) or CaV1.3S-VC/CaV1.3S-VN (right). Fluorescence of the spontaneously reconstituted Venus is shown in green. The insets show expanded views of the soma and dendritic regions marked by the dashed boxes. Overexpression of these channels does not change the cluster size observed with super-resolution microscopy (see also Figure 10—figure supplemental 1). (B) Representative traces of spontaneous action potentials recorded from neurons expressing CaV1.3S-CRY2 and CaV1.3S-CIBN before (left) and after (middle) the induction of fusion with 488 nm light and after subsequent treatment with 10 µM nifedipine (right). (C) Bar plot showing the AP frequency (normalized to the peak frequency) for each condition. Bars are averages of 4 cells ± SEM (*p<0.01).


