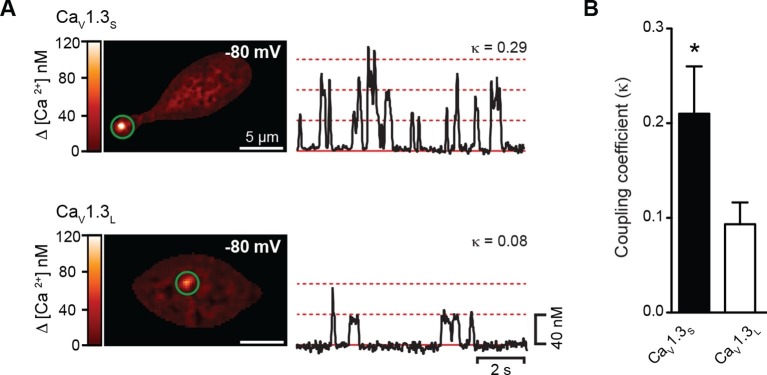
Figure 2. CaV1.3S but not CaV1.3L channels gate cooperatively to increase Ca2+ influx.
(A) TIRF images of spontaneous CaV1.3S (top) and CaV1.3L sparklets (bottom) at a holding potential of -80 mV in tsA-201 cells expressing the respective channels. Traces at the right show the time course of [Ca2+]i in the sites marked by the green circles. The dotted red lines show the amplitudes of 1 to 3 quantal levels. The coupling coefficient (κ) is shown above each trace. (B) Bar chart showing the coupling coefficient for the CaV1.3S and CaV1.3L sparklets sites. Bars are averages of 5 cells ± SEM (*p<0.05).

