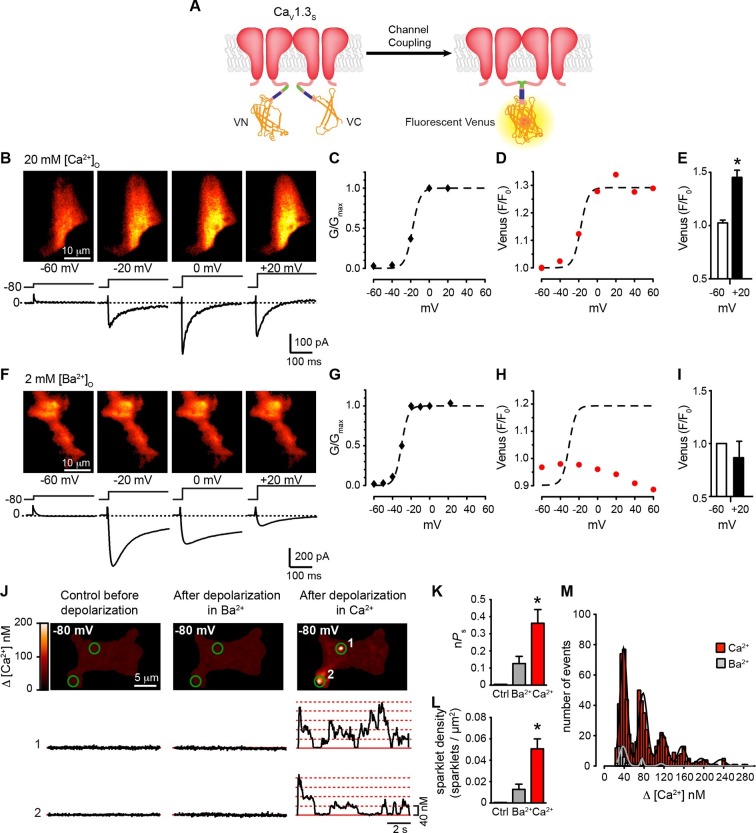
Figure 5. Coupling of CaV1.3S channels is Ca2+-dependent and increases channel activity.
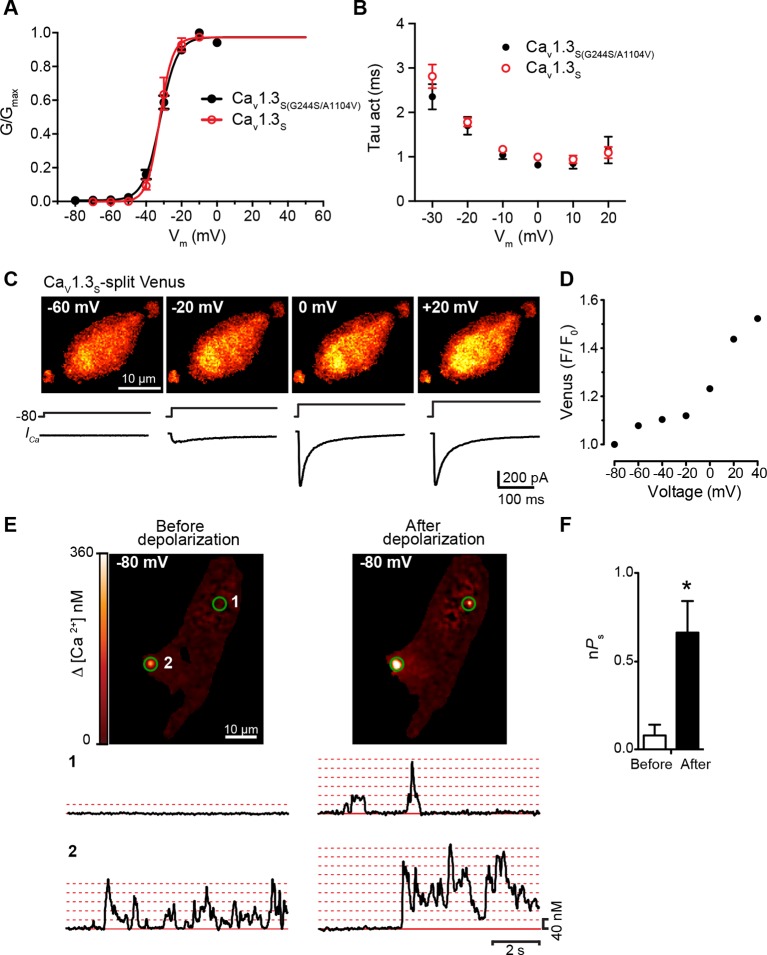
(A) Schematic of CaV1.3S fused to VN and VC fragments of the Split Venus bimolecular fluorescence complementation system. (B) TIRF images of Venus fluorescence reconstitution in the presence of 20 mM Ca2+ in tsA-201 cells expressing CaV1.3S-VN and CaV1.3S-VC (top). Fluorescence reconstitution was measured in response to 9-s depolarizing voltage steps from a holding potential of -80 mV to test potentials of -60 mV to +60 mV. ICa currents evoked at the different voltage steps (bottom). (C) Voltage-dependence of the normalized conductance (G/Gmax) of the ICashown in (B). Dashed curve is the fit to a Boltzmann function. (D) Voltage-dependence of Venus fluorescence reconstitution in the presence of 20 mM Ca2+. The Boltzmann function calculated in (C) is superimposed to compare voltage-dependence. (E) Bar plot of averaged Venus fluorescence in the presence of 20 mM Ca2+ at -60 mV and +20 mV. Bars are averages ± SEM (*p<0.05, n = 5 cells). (F) TIRF images of Venus fluorescence reconstitution in the presence of 2 mM Ba2+ in tsA-201 cells expressing CaV1.3S-VN and CaV1.3S-VC (top). Format and protocol are as in (B) IBa currents evoked at the different voltage steps (bottom). (G) Voltage dependence of normalized conductance (G/Gmax) of the IBashown in (F). Dashed curve is the fit to a Boltzmann function. (H) Voltage dependence of Venus fluorescence reconstitution in the presence of 2 mM Ba2+. The Boltzmann function calculated in (G) was superimposed to compare voltage-dependence. (I) Bar plot of averaged Venus fluorescence in the presence of 20 mM Ca2+ at -60 mV and +20 mV. Bars are averages of 5 cells ± SEM (*p<0.05). Venus reconstitution was also tested in the presence 2 mM Ca2+ (See Figure 5—figure supplement 1) (J) Top: TIRF images of CaV1.3S sparklets recorded at -80 mV in 20 mM Ca2+, before depolarization (left), after the same depolarization protocol used in (B, F) in the presence of 2 mM Ba2+ (center), and after depolarization in the presence of 20 mM Ca2+ (right). Green circles indicate sparklet sites. Bottom: Traces of the time course of [Ca2+]i in sites 1 and 2 under the three conditions. (K) Bar plot of the averaged CaV1.3S sparklet activity (nPs) before depolarization (black; average is ~0), after depolarization in Ba2+ (gray), and after depolarization in Ca2+ (red). Bars are averages ± SEM (*p<0.05, n = 5 cells). (L) Bar plot of sparklet density. Format as in (K). (M) Event amplitude histograms of CaV1.3S sparklets recorded after depolarization in the presence of Ba2+ (gray) or Ca2+ (red). The amplitude of elementary CaV1.3 sparklets was calculated by fitting histograms to a multicomponent Gaussian function. The experiments in this figure were performed using the CaV1.3S channel encoded by the Addgene plasmid 26576, similar results for split Venus reconstitution and sparklet activity were observed for the plasmid 49,333 (Figure 5—figure supplement 2).


